
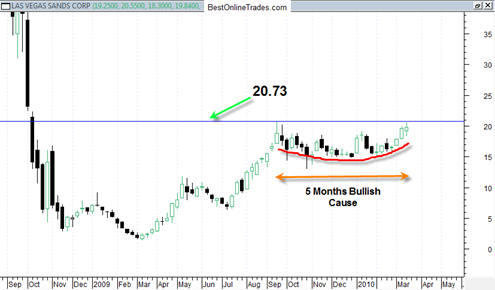

Las Vegas Sands (LVS) the casino and gambling co. has what I consider to be a very bullish looking weekly candlestick chart. It is interesting that the basic structure here is somewhat similar to the way GE General Electric looks and GE recently managed to get a substantial sign of strength breakout on huge volume.
The challenge for LVS is to get a sign of strength weekly price breakout over and above the 20.73 level. The price chart shown above has a lot of sideways cause and is a bullish sign for supporting an extended weekly breakout.
Assuming a breakout (perhaps next week sometime ?) a quick retest back to the 21 area would be expected and preferably on low volume. The sideways pattern of the last 5 or 6 months resembles a saucer formation.
Assuming a breakout, a move to 25 seems reasonable and maybe it could do that in a 4 to 6 week time frame.
A very nice looking chart with plenty of bullish possibilities.