
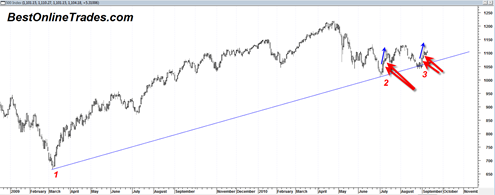
The market reaction off of the up trend line in force since March 2009 has so far been touched 3 separate times. The more times a trend line is touched the more it tends to validate that trend line. Key also is the observation how the market reacts off of an uptrend line. The way to determine that is to look very close at price behavior at or near the up trendline and then to see the follow on reaction or lack of it.
In the case of the most recent two reactions I can clearly see that the market has shown a strong price reaction off of the up trend line. They were wide candlestick bars and clean follow through. This is a very bullish sign in my opinion.

It is a very simple chart with no indicators, volume or anything else to interrupt the analysis. It is simply an up trend, price and one trend line. Gary Fullet, a commodities trader taught me that a long time ago. He told me that I really need to learn to WATCH markets. He meant to watch and respect the tape, the reactions, the size of the reactions, the indications of distribution, ‘shortening of the thrust’ and so forth and so on. These sometimes minor clues can evolve into huge long term trend changes.
But I would say that the most important time to observe market reactions and or reversals is at key support and resistance levels which is clearly obvious from the chart above as shown by the red arrows.
I was looking at the exact same chart.. Great minds think alike Tom.