
Here we are early in the last week of August 2010 and guess what? My 1987 crash fantasies are creeping in again. Perhaps I need to dial a 1-800-crash-aholics anonymous support line if there is one? When the market gets into a stance that I find somewhat similar to the 1987 crash I start to look at the charts and indicators and see if there is any interpretation that could result in a similar occurrence. Every single time I have done this in the past has failed so far. But now I am about to do it again…
I am sure you have already read about the double Hindenburg Omen sell signal which I previously never really followed. It seems to have a very interesting record which I was reading about over the weekend. It is interesting to me that this signal is now ‘live’ in the context of the overall price action right now. It is also interesting to me that the expected occurrence of the crash could start as soon as 1 day or several months.
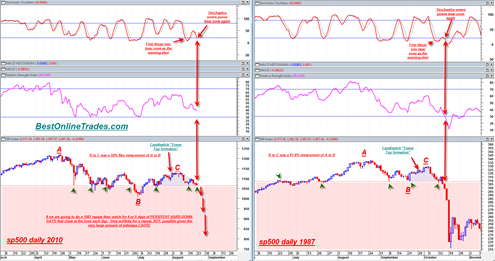
Right now there really does not seem to be any price pattern symmetry between the two periods in terms of time. The 1987 topping formation formed rather quickly and resolved itself just as fast. The current topping formation since our April 2010 high has dragged on forever it seems and the price action appears much more complex.
Still, the overall pattern of the 1987 stock market crash was basically an A B C down as well as some other characteristics which I will get into in a minute. The B to C portion of the 1987 crash was the final upwards retracement rally before the plunge. In the 1987 period this was a 61.8% fibonacci retracement.
During our 2010 upwards B to C retracement rally we only managed to get to a 50% fibonacci retracment level near the 1030 level (actually it was slightly more than a 50% retracement but not quite 61.8%).
The other observation I want to make about the 1987 crash was the fact that before the crash the price of the sp500 leisurely traded along a well defined support and resistance zone. The level was 308 at that time. Just imagine throwing a heavy rubber bouncing ball on a somewhat thin sheet of ice. That ball will bounce up and down over the sheet of ice and move forward creating a series of tower tops. If if eventually does bust through the sheet of ice it is likely to be a dramatic break through. That is the best way I can describe the 1987 crash. Price coasted along this 308 level for quite some time creating a series of tower tops. Eventually when the timing was just right it busted through and then just dropped relentlessly because it has a lot of sideways energy built up in preparation for the move.

I show the green arrows in the chart in both time frames as the points where price was hitting this resistance and support zone.
In 1987 after the market formed its final tower topping formation it was able to bust through the resistance line and then just let gravity take over. It has enough cause to do so from all the sideways energy built up.
The present time frame shows that we again have a tower topping formation and price action was bearish today and finished at the lows after an attempt at a rally earlier in the day.
Also important to note is that the 1987 crash was kick started after the second entering of the stochastics below the 20th percentile line. The warning shot was the first entry below the 20th percentile line, but then the second entry below this line resulted in the crash. These two events correlate right before the crash was about to start.
In the current 2010 time frame we see that stochastics have busted below the 20th percentile line already right in a similar area relative to the 1987 crash chart. Stochastics have since rallied back up the mid point line and have now headed back down and appear ready once again to cross below the 20th percentile line just like occurred in 1987. This was the precise moment the crash initiated in 1987.
The stochastics on the sp500 1987 crash low point day of 10/19/1987 hit a super record low value of .859 I looked back all the way into the 1970s and I dont think we have ever seen the stochastics get that low.
Relative strength index right now is at 39 in a somewhat similar level to the 1987 period. There are other comparisons as well. Look carefully at the 1987 portion of the chart and look at the ‘teaser reversal hammer’ that occurred near the vertical double red arrows, just a few days before the start of the crash (The right most green arrow is pointing right at it). This teaser reversal hammer was the most devious reversal hammer of all time in all of market history because it was a false signal and tricked people into thinking another topside reversal was coming. Also important to note is that the bottoming tail of this reversal hammer managed to slightly PIERCE the lower Bollinger band (not drawn in ).
The most recent candlestick reversal hammer that we printed last Friday 8/20/2010 also pierced the bottom Bollinger band (not drawn in).
The main point here of the similarity is that we have these tower tops and the long trading range that means the market has built up A LOT of energy for a big move. That is why the market was able to trade so far and fast in 1987.
Now we have just as much sideways energy built up. If the market wants to get this type of move going now then it is the right time and place to do it (but honestly the doubt about the time factor is the question of whether it is possible for such a move to occur in late August with light volume characteristics instead of traditional September or October).
At this point one has to ask who is left to support the market if we actually do break support this week? The retail crowd seems to be buying into the bond bubble. The bears looking for a crash since April 2010 are probably badly wounded at this point and maybe non believers at this point?. There will be support for the market but the question is at what level. It could be much lower than we think at this point.
The way the market is setup right now for this scenario leaves little room for indecision. Either we head down hard tomorrow to kick start this decline, otherwise this ultra bearish scenario will probably fail.
I will only do a follow up on this comparison theme if I see very clear evidence that it has engaged…
Tom
Thank you for your analysis. It is compelling. Strangely, with all the disappointments over the past couple months, your analysis tonight is more “compelling” and sounds “spot on.”
I remember the 87 crash well; at least I think I do. The week before the crash, I was overseas but following the market closely. Almost every day for preceding 5 days, it seemed that the market was losing 50 points @ day, which at the time was a lot, and it seemed very unusual. When I landed back in the US, in Chicago, I had the day off – – for some reason I think it was a Tuesday and that was the day of the Crash. On that day the market just kept going lower and lower, but my recollection was that the biggest losses were in the final hour.
In today’s environment, I think we need to consider that circuit breakers will almost for sure come into play which may not make a potential crash play out as a bear might hope. While I might easily lose out on some gains, I might cover some of my shorts if the overall market is down 8 – 9% even though I might expect it to go much lower (maybe double that loss)
If we actually do get a stock market crash, I forgot to mention in my post that it would maybe occur over a 2 to 3 week time period instead of just 4 days. Seems consistent with the overall pattern and the fact that 2010 topping pattern took so long to form…
Crashes are such rare events. Most of the time price just churns. I am going to be quite amazed if we actually get a done deal this time.