Who
is Marty Armstrong? Marty was formerly the head of PEI (Princeton Economics International),
a New Jersey Institutional money management firm. They used to have a website
at pei-intl.com with a wealth of historical and current information on all markets.
I did not know Marty personally, but only through his infrequent guest appearances
with California radio personality Buzz
Schwartz. Buzz occasionally had Marty on his show, where he talked about the
PEI confidence model and where he saw markets heading.
The reason why Marty
no longer appears on Buzz's or anyone else's radio show, nor produces the monthly
'World Capital Market Review' is because Marty is currently in Jail.
Marty's firm PEI managed over a billion dollars of capital from investors all
over the world, in particular Japan. The Japanese accused Marty and PEI of mismanaging
the funds and sued him and his firm. The U.S. government also cracked down on
him and ordered him to disclose the whereabouts of all his assets. He did, but
the government said he was not being fully cooperative and for this reason continues
to keep him in jail. The government shut down the PEI website and ordered all
of its services cease immediately. This is a very brief paraphrased version of
the story.
Despite
the sequence of events that led PEI to its end, as an observer I do still to this
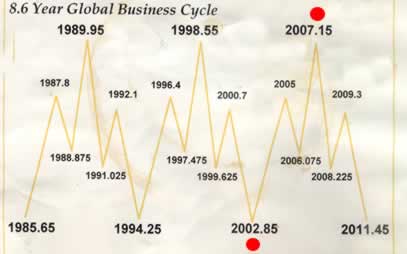
day find value in PEI's 8.6 year cycle model. The real value comes in simply by
keeping track of important cycle model turning points. They do not happen that
often, but when they do it is worth it in my opinion to be aware of it as a means
of identifiying a possible market turning point. The proper way to read the dates
below are as potential turn dates. For example, the 1998.55 date was a
key turning point during the 1990's bull market. The PEI confidence model accurately
predicted this turning point as July 21st, 1998. That was the exact top to the
day during that year before a subsequent 22% decline into October of that year.
What is most amazing about this turn date as well as all of the others is that
this cycle model was created in the 70's. How many models do you know that can
accurately predict a precise turning point in the markets to the day 2
decades in advance? Probably none. It cannot be expected that this cycle model
always pick exact tops and bottoms to the day. Sometimes the correlation is weak,
sometimes strong, sometimes non-existent. In addition the PEI model below is supposed
to be taken in the context of global capital flows, not just the USA markets for
example.
Note that the model also accurately picked the precise final top
in the SnP500 with the 2000.7 turn date. Other notable turn dates identified were:
1989.95
The final top in the Nikkei
1987.8 Right before the 87 crash
1999.625 The
low in Gold
2002.85 The low in SnP (not pinpoint precise)
There are
a number of others as well. But the main point is that the
PEI model is worth glancing at once in a while for potential turning points in
the markets.
The model was created by examining hundreds of years
of historical financial market data, crashes and panics and currency relationships.
He was then able to come up with the model that described regularity in economic
cycles within a global capital flow context. I remember him saying that the world
cannot have a true bull market in anything unless there is worldwide participation.
There must be a concentration of capital in the preferred asset class of choice
to keep a sustainable bull market.
Marty in fact made his first fortune
in the gold market of the 70's. In some of his last commentary from the year 2000
he states:
"Historically, bull markets are created when capital
concentrates, and that focus is in the stock market for now. When that concentration
breaks, capital will look around for the next great investment. That should be
the commodity cycle between 2002-2007 and perhaps extend out as late as 2012.
For now, the metals should make their final lows by 2002"
and
then comments on gold in 1999 with the following:
"In the past,
every 8-year cycle in gold has produced an important low and the next target still
remains 2000. A low under $252.50 next year will qualify for such an 8-year cycle
event that should then be followed by a true bull market into 2007 peaking with
the next Economic Confidence Model turning point. Given the fact that we have
a Panic Cycle Year in 2005 and the underlying strength of our long-term
momentum indicators, it would certainly appear that gold should exceed its 1980
high going into 2007."
The above two snippets from Marty's last
words before heading off to jail to me are very important. During that time frame
he also made a comment about bonds stating, "The next Yearly Panic Cycle
in bonds is showing up in 2003." he wrote those comments in 1999! And as
it turns out the year 2003 saw one of the most volatile declines in bonds ever.
He identified the panic cycle in bonds as having yearly significance. This is
clearly more significant than any smaller time frame and suggest a bigger more
trend changing type of move.
The term 'Panic Cycle' was one of a number
of other market terms used to describe potential market action. 'Volatility' and
'Directional Change' were other terms used within his computer model. Panic Cycle
suggest fast and wide price movement, with longer term time frames having more
significance.
I find it very key that Marty indicates 2005 as a yearly
panic cycle for gold. It suggests to me that the end of the first major impulse
wave of the gold bull market could peak in 2005. This is my current thinking at
this time. But obviously there are many factors that must also fall into place
in order for this to happen. But I am looking for a guidepost, and this may be
one of them. If true, it would suggest that the broad market be subject to a severe
decline in 2005 which makes sense based on the end of the 2004 election cycle
and some of my other cycle indicators.
With respect to today's most recent
market action, the broad market is still hanging onto the lower bounds of the
triangle pattern, not having made up its mind on which way to break. The mining
stocks looked poised for a good bounce from here. I am still hoping for the pattern
setup that makes the spike decline in the XAU of recent weeks a 'spike head' of
a reverse H&S pattern (see first chart in this
update). That would certainly be a most ideal scenario going forward, and
keep the classic Wyckoff 6 year neckline retest in good standing. |