
For the very short term outlook there may exist a modified version of the bullish harami cross candlestick pattern in the sp500. This occurs when one sees a long body down candle and then a doji on the next day that is fully engulfed within the previous day’s candlestick body.
We did not exactly achieve the full engulfing of the doji today, but we still have a slight resemblance to this reversal candlestick setup and it may follow through to the upside tomorrow.
We are also pretty close to the 50 day moving average now as well. Volume today dropped off dramatically as compared to yesterday. In some cases as much as 50% less as compared to yesterday. But today was an inside day so nothing was really proved in terms of that volume.
Momentum is still clearly down in the daily time frame. Perhaps we need a gap down tomorrow near the 50 day moving average and then an end of day reversal to seal this area as a stronger reversal area.

If we forget about oscillators and indicators for a moment and just focus on the overall price pattern structure that has occurred since the April 2010 time frame, one could make the case that the current 7 to 8 day decline is simply the beginning handle formation of a quite large cup and handle pattern.
The recent big move up that occurred in early November 2010 is reflective of many stocks perching up to near their 52 week highs and then breaking out. Of course not all stocks were able to break out. Some made a strong move right up to the April 2010 highs level while stronger stocks broke out above this level. The weakest stocks of course are still not near the 52 week highs at all. So when we look at the AVERAGE of all these stocks as indicated by the sp500 and other indices we see a picture where the index has blasted to new 52 week highs and created a large opening gap, but then during the last 8 or 9 days we have retraced this breakout and profit taking has come in.
This profit taking wave is a very common occurrence near 52 week highs because there always exists a crowd who bought at the previous highs and would like to get their money back (those that bought near the April 2010 highs). This type of dynamic is what creates the handle of a cup and handle pattern.
If you have been reading and following the posts here at BestOnlineTrades over the last several months then you know that I have talked about the smallish 38.2% retracement of the entire March 2009 to April 2010 rally as being a significant sign of strength of the market. Despite all the bearishness between April 2010 to September 2010, the market could only manage a 38.2% retracement. I believe this strength still has to be the presumption. However I should say that the volume characteristic is not a supportive factor.
So the most bullish presumption at this point is that we are simply now creating a handle of a cup and handle formation and that the handle low was just put in. This is quite a strong presumption to make. It will only become true if we start to see a strong upside reaction from here that shows real demand. The sooner the current decline is stopped, the more bullish the potential cup and handle pattern we have on our hands in my opinion.

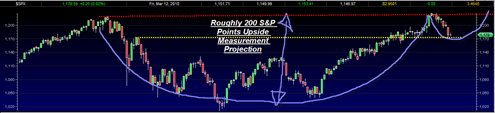
The chart above shows that the current price level (as denoted by the yellow dotted line) is somewhat in a supportive range and we could easily bounce higher from here.
I have drawn in what this cup and handle may look like and you can see that I have drawn in the handle to stop right near current levels which would be the most bullish presumption. The handle could go farther down and still create a bullish setup, but I prefer we hold current levels.
If this structure become successful then it could imply that we have roughly 200 S&P points to play with on the upside which is clearly significant.
So for the most bullish presumption, look for the possible bullish harami cross reversal to take hold this week and for us to hold the current levels as the base of a small handle formation.
Sentiment, and the ARMS index readings as well as the summation index and percent of stocks above 50 day moving average do not seem to confirm the current levels being anywhere near a final low. So the drawn in cup and handle structure may just be wishful thinking for now. Still, I view it as an interesting scenario and one worth watching for potential validity.
Well Ben Shalom Bernake (B.S. Bernake) must be working late because the futures are up tonight, but I’ll make my bearish case anyway. Simply, the SPX is rolling over on the second top of a double top on the weekly chart. We currently have a bearish Harami on the same weekly chart. The top of the double top is at the 61% Fib retracement level from the 2007 highs.
The Aall Investor Sentiment Index closing wk (Nov 17) showed “dramatic” decline of bullish from 57% to 40% but the drop went almost totally to the Neutral category rather than Bearish which inched up to 32%. Nevertheless, it was a win for the bulls that the bullish indicator could be reset that easily with such a paltry decline (only 400 Dow pts). But having said that, if the market takes off from here, I think the bullish % will swell rapidly and the market will not go all that far.
I think the bullish juices will be re-ignited if the GM offering is a spectacular success. If it is perceived to be a failure than that could be the trigger event to spike down. Since the offering has the backing of the US Gov + the brightest minds on Wall St, I think you have to assume that the debut of the new GM will either succeed brilliantly or at least the new GM will trade 5 to 10% above its initial offer price which alone will be considered a huge success. If so, than market will muddle onward.
I think the market is going to “muddle” thru and defer any grand resolution of bull or bear case until mid – January. There are too much uncertainty in Washington, too many unresolved topics (e.g. taxes) for an explosive upward market move now. While Obama shows supposed hints of changing, the Democrats just reanointed Pelosi and she is a very polarizing figure.
Since I have been watching the market for 40 + years, I have NEVER known a dramatic decline or anything like a dramatic decline to occur between Thksgiving and year end. I think there are a lot of year end cross currents to account for that. Maybe we are at double top (I think possible) or maybe we are forming a handle which mean we have more life to the fake “party” being held by Bernanke. If so, the party can last until mid 11, altho partgoers may start to exit around May.
I think we muddle thru with no great victory for either the bull or bear camp. . . until mid Jan 11. A “window” exists today and tomorrow (Nov 18, 19th) but I think extremely remote that bears will get what they look for. I am a very sad bear.
I agree that Thanksgiving week is unlikely to be hard down. Very remote chance.
I think this cup and handle chart I have drawn in may have some decent possibilities, but it still has more work that needs done on it.
If this cup and handle starts to evolve successfully then it would seem to indicate about 200 S&P points to the upside. Certainly plenty to go around for everyone, bears and bulls alike.
I think there will be another strong bear case but it will take more time to evolve. For now the politicians and Bernanke seem to have this market on puppet strings.
As far as congress, I thought that nothing really major will be put on the plate until early next year when new session of congress begins is my understanding. So that might support the view that the market could continue higher into end of year and then start more corrective as new year starts when congress starts making all kinds of new plans and decisions.
Ed, you could be right. How we finish the month of November is going to be quite revealing. Closing near 1176 in the sp500 by end of November would be quite the bearish setup in my opinion. But the market may get its running legs again as seasonality seems to be coming into play now.