
The Russell 2000 is falling into its traditional role of early market leader and today closed at a new 52 week high and above the swing high that started the ‘mini earthquake bear’.
I suspect that the other major indices will soon follow suit to the upside. The Dow Jones Industrial average almost tagged the 2/18/11 swing high today but then sold off a bit near the close. It is possible that we could see a day or two of downside consolidation since we are at the previous highs on a number of indices. However, after that I would expect the markets to trend higher again.
The sp500 managed to completely evade the large quarterly shooting star candlestick by trading higher in almost straight up during the last 9 trading days. This was an astonishing feat because there was real potential for the quarterly candlestick to turn into a very bearish longer term signal. But instead it now just looks like another typical bullish candlestick that we have become so used to seeing lately on the indices.
The monthly candle in the sp500 now looks like a very long bottoming tail doji hammer reversal candlestick which has the potential to lead to a big up month in April 2011. The problem with this candle is that it can also be interpreted as bearish hanging man candlestick since it is at the top of a huge price advance. So it will need confirmation of the bearish setup or a rejection. A rejection would mean we simply trade higher up into April 2011 which appears likely.
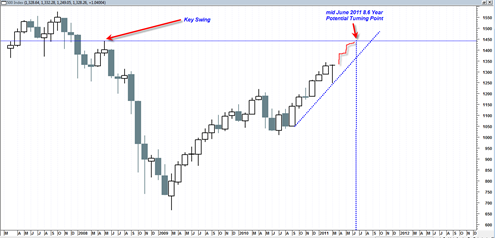
So it seems clear that the longer term trend is still up. This train is still in motion and still has plenty of momentum going for it. The only thing I can think of at this point that would stop this train or at least cause it to pause is the 8.6 year Marty Armstrong Global Cycle Turning Point which comes in on June 13, 2011.

So that would only be 2.5 months away and it may put the sp500 near a test of a key swing point as shown in the chart above. I do not know if the sp500 can move that much higher in just 2.5 months. We will just have to wait and see. But if we do see the sp500 move up to that swing point and we also see the date of June 13, 2011 arriving, it may be a key stopping point for the market and possibly a top. But for now this market seems want to trickle higher the next few months…
As I posted earlier, the month of April is the best month for the DJIA index since the 1950’s. I read something a week ago or so ago where the case was made that gold and the DJIA are going to go up together. Of course that would be another bullish case for gold.
I see a strong bullish continuation candlestick pattern in the US Dollar today. We may see a temporary slow down in stocks and gold if it pans out tomorrow. The last day of March historically bearish for stocks while April 1st is bullish
Thanks for the interesting stats Ed… your take makes sense the way the markets are setup right now hover near the previous highs…