
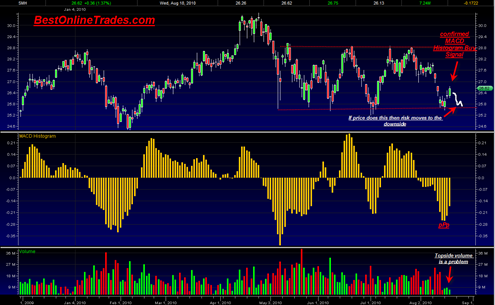
The Semiconductor HOLDRs SMH ETF today confirmed an MACD Histogram buy signal. In previous posts I have been looking for yet another move in the broad market higher as a bounce from the bottom of the recent swing trading range.
The other indices have as of yet not confirmed an MACD Histogram buy signal but the SMH was able to get the job done today by a few pennies by closing above yesterday’s swing high of 26.52. I mentioned before about how the SMH can sometimes be a good leading mover slightly ahead of the rest of the market and can sometimes be used as a guidepost for other markets to follow.
If we look closer at the most recent 3 candlestick closings on the SMH it is not necessarily something to get all excited about. My point is that despite the confirmed MACD histogram buy signal today I am not seeing clear and present evidence that the SMH wants to zoom higher to the top of the swing trading range near the 28.5 level.
We need to see a strong bullish candlestick that pushes the SMH strongly higher soon or it may create more doubt about the sustainability of the SMH to move substantially higher again into the top range of the swing trading range.

Generally speaking, after a stock or index touches the bottom of a swing trading range I like to see somewhat quick reaction back topside with confirmed signs of strength. If instead the stock or index LINGERS around too long near the bottom of the swing trading range with dojis, shootings stars or other semi bearish candlesticks then it instills doubt about the ability of the market to move back topside.
The bearish case will start to become more keen if the SMH breaks down the remaining two days of this week. Why? Because I do not like to see price hang around this level too long, hugging the bottom of the long term swing trading range.
I would be remiss if I did not also mention the HORRIBLE topside volume of the last 3 trading days. The volume comparison between the last 3 up days and the big drop that preceded it is astonishing.
So again, the SMH needs to get up off its lazy butt and get MOVING higher SOON and with conviction into the end of this week, otherwise the risk starts to grow quickly for a downside possible break through long range swing trading support. If that were to occur it would likely be a very large and fast move given the significance of this long swing trading range support.
The title of this post is “SMH confirms MACD Histogram Buy Signal”. The problem is that sometimes buy signals fail especially when they are not being strongly confirmed with volume conviction which appears to be the case now.
Today’s and yesterday’s price action also showed topping tails in many indices which is showing supply coming into the market in that range.
So the bottom line is that the market needs to head higher with conviction into the end of this week and preferably a close above 1100.14 on the sp500 for a more bullish scenario to unfold.
But if on the other hand we retrace down again into the end of this week and do so on increasing volume relative to the last 3 days, then it is going to put the market at significant risk of a break down through the large swing trading range. . .
Hi Tom,
If you recall, I had posted a comment recently regarrding taking a short position in AAPL and PCLN. Both have seemed to do relatively well for me recently (AAPL more so than PCLN). However, today’s end of day late reversal in PCLN was impressive on decent volume. Looking at the daily chart, it is still overbought and there is a nice shooting star formed today,. I would love to hear your feedback on this stock. Do you think this shooting start candlestick signifies that the stock is ready to reverse and head lower to test the 270 support or is this just a bear trap in an overall bullish stock. Personally, I think the stock is qway overvalued and trading extremely richly,.
Also, would love to hear an update from you on AAPL since it has broken down from the wedge pattern it was in .
Thanks again for your hard work and would love to hera from you soon !!
Cheers!
Hello Ayush,
Yes it does look like both are due for a drop soon. We are entering seasonal weakness now that is pretty serious. Paper equities could be in trouble… volume is horrible on rallies recently.
The real drop may be delayed until early September however…
AAPL looks bearish on the weekly but still needs confirmation. PCLN could drop just based on sympathy decline.
http://www.bestonlinetrades.com/20100818/apple-inc-and-the-powershares-qqq-trust-look-toppy/