
A small bearish Gartley Fibonacci pattern has been identified in the DIA ETF (the ETF that tracks the Dow Industrial Average) and it could be a key factor in how the market structure develops into the end of this week.
There are only 4 days left in March 2014. So that means end of Month and end of Quarter and one has to consider the possibility that a little ‘upside tape painting’ would be logical to occur for a few more days into end of this week. This is interesting because if this small amount of upside tape painting occurs, it would help the set up of this potentially bearish Gartley Pattern in the DIA ETF.
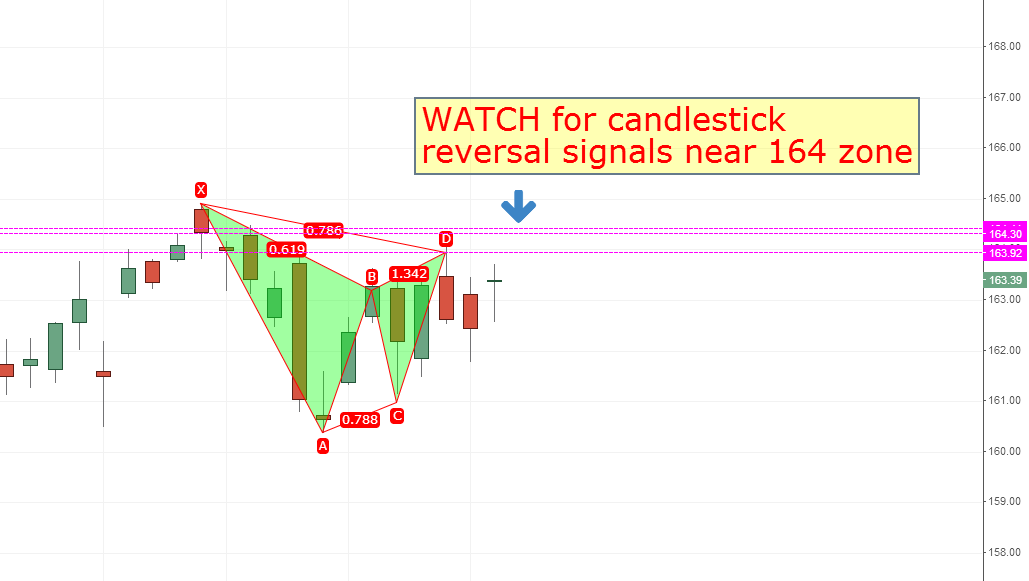 DIA ETF Daily Chart March 2014
As one can see from the chart, this very small potential bearish Gartley pattern is projecting 3 potential reversal zones between 164 and 164.40. The proper way to asses whether or not such a Fib pattern is going to work is to watch price candlestick action as it moves into the potential reversal numbers. When and if the numbers are hit, then one must try to focus on the candlestick price behavior for clear signs of reversal and then confirmation that a new bearish leg wants to engage. This signal can come in the form of a candlestick reversal pattern (for example shooting star, doji, gravestone doji, gap up and then full bearish engulfing candle, hanging man candlestick etc etc.).
Just to be clear, the discussion centers around daily price bar signals and interpretation.
What I have seen in the past is that sometimes the situation occurs where a small Fib pattern nails the top or bottom in a stock or index. During my scanning over the years of previous market tops and bottoms I have seen some market tops get nailed quite precisely with a Fib reversal pattern. Sometimes they are precise, and other times they work on a slight delay factor. For example in January February 2009 there was a bullish Crab Fib pattern that was setting up and it was indicating a reversal in the sp500 near the 750 zone. As it turns out that level was only about 7 days and about 75 S&P points away from the final market bottom on March 9th, 2009.
So now we have this very small bearish Gartley pattern in the DIA that is suggesting to watch the 164 to 164.44 zone for reversal potential. Ideally we would drift up there into the end of this week and maybe finish the week with some type of doji or shooting star candlestick.
Sometimes these Fib patterns do not result in price moving up into the reversal zone and instead price reversals down fast very swiftly before any of the aforementioned levels are tested. In fact sometimes they are never tested and the market or stock just reverses earlier. So one has to be open minded. The market may reverse down hard at any time this week.
The week that starts next week is very key because I am relying to a certain degree on Marty Armstrong’s model which says it is slated to be a panic cycle week.
The fact that March 31st next week is slated to be a panic cycle week is very interesting to me because of the current context of this small potential bearish Gartley reversal pattern. The pattern makes it quite clear that there is a small window more of price advance, but after that we should start to head down. This fits in very nicely with the timing of the beginning of the Marty Armstrong panic cycle week to start on March 31st 2014.
I would also suggest that one take a look at the price structure and the MACD for the period up to July 22, 2011. The sp500 made a small double top at that point and it resulted in the daily MACD moving into a bullish crossover. It appeared precisely on that date that the market was ready or pretty close to breaking to new highs. But yet it was still below previous peaks as is the case in the current market action over previous several months.
This move into a double top ended the market advance in late July 2011 and then the market plunged for an approximate 15% decline for about 15 trading days. The decline was persistent and was cascading in that we see price candlesticks that were increasing in size as the move continued.
The decline that began from October 2, 1987 lasted about 12 days to the panic low. 12 to 15 trading days is essentially 3 calendar weeks. So if we project out 3 weeks from March 31st next week (the week that is supposed to start the panic cycle) then we get close to the April 20th to 21st cycle magnet date.
So one can see how a potential scenario is developing right now where the market drifts around a bit more this week waiting to show a serious sign of weakness to the downside. If and when this kickstart move to the downside begins, it could very well be the fumes that lead to the fire of a major market downside move into April 21st.
I keep mentioning this April 21st date and the Marty Armstrong March 31st week panic cycle date. I want to be clear that I did not come up with those dates but I am relying on my sources that they have strong potential to lead to highly volatile market action, perhaps even crash type market action.
By the way I do find it quite odd and unusual that this supposed April 21st Astro date is also Easter Weekend and April 20th was Hitlers birthday. I will let you try to come up with an interpretation of what that means, but the bottom line is that April 21st date something ‘huge’ is supposed to happen or at the very least it should be a key market magnet date (either a high or a low). At present I am unable to see how April 21st could be a major market high, at least for now. Certainly anything is possible with the market, but everything I am looking at right now suggests it will be a key low.
The US Dollar continues to show probability of making a solid bottom and a ferocious upside rally. The Bonds TLT ETF also looks like it is in a stance to skyrocket. These two factors are also consistent with a downside market move.
The VIX right now is basically like a rubber band at full tension and is being pushed on time and time again and yet it fails to budge any more to the downside. That tells me when it is finally ready to get a rally going to the upside, it will move very swiftly to the upside with pullbacks being modest and contained.
The McClellan summation index continues to be in a bearish stance and show more downside momentum despite today’s market rise.
I am looking to go ‘all in’ short this market, but am presently on the sidelines. I am awaiting confirmation and want to give the market a little more breathing room to the upside.
If one looks at certain individual stocks such as IBM or JPM one would think we are ready for another huge upside leg in the market. However on some of the strong DJIA Stocks such as CAT and MSFT there exist bearish Fib pattern setups that could halt their advances in short order. JPM also has several bearish FIB patterns that suggest it’s advance will be stopped soon.
If the scenario starts to show confirmation we should start to see serious persistent downside price action in the DJIA and sp500 starting sometime this week or very early next week. Then, once initiated, the target resolution for the low would ideally be near April 21st 2014.