
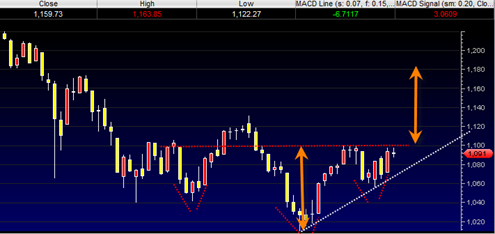
Here is the inverse head and shoulders pattern I was talking about yesterday on the SP500. The neckline of this pattern is roughly 1100 and so it is pretty clear at this point that the battle line of near term consequence is 1100. A big breakout above this line and it would go one strong step further to confirming the bull case. A failure below 1100 is not necessarily the end of the world, but it does become a problem as we get closer to the white short term uptrend line I have drawn in the chart below.
At this point I have to tip my hat in favor of the bullish breakout scenario for reasons I pointed out in yesterday’s post (Mcllellan Summation Index, Macd curling over the zero line). A close above 1097.50 would confirm the MACD histogram buy signal.
If this really is a head and shoulders bottom it would be ideal for it to be confirmed with a strong move early next week that shows a wide price bar and preferably on robust volume.

The pattern if confirmed has a potential measurement target to 1180. If the breakout does not occur next week then prices are either going to go sideways or down. But again, the white uptrendline is where price must hold to keep the recent bullish tendencies of the market intact.
I have to say the bullish action is relentless – a constant grind up. TZA formed a bearish flag on the daily chart. I went long TZA at the bottom of that range today. I know this is completely counter trend and aggressive, but it’s a low risk/high reward trade. Since TZA is near it’s bottom, I’m counting on the flag to fail or at least for TZA to bounce in that range for a while. If it reverses here, it should be good for a quick $6-8 pop. If my trade fails and the TZA bear flag works, I would have to go with Tom’s bullish scenario.
I could be wrong but I think it is very unlikely that S&P will cross 1153 Intraday anytime in next 12 months.
If S&P reaches 1180 then it will definitely go above previous high of 1219 as lot of stop losses are in the range 1176-1188.