
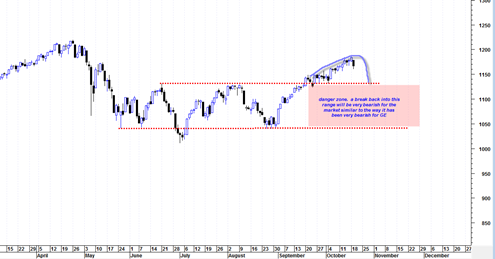
If this omen regarding General Electric Company still holds true then the picture is not looking very good for the sp500. GE has shown in recent weeks a false upside breakout followed by a very high volume break down and 2B sell signal that was on higher volume than the May 6, 2010 flash crash. This is not good. It is saying to me that GE can move back to the bottom of the current swing trading range eventually.
If GE is still somewhat of proxy for the rest of the broad market, then it could mean that the sp500 is headed for some serious downside in the weeks ahead. But there is still plenty of tape action between now and then, and there could still be remaining topping action in the current range before anything too serious gets started.

The chart of GE above shows the parameters I am talking about. The most striking aspect of the chart is the high volume break down back inside the trading range that is greater volume than the May 6 2010 flash crash. This is a very bearish sign and possible sign a new impulse move down is on deck.

If you look at the sp500 chart above you can see the comparison I am trying to make in terms of the low volume false breakout and then the possible move back into the swing trading range which would imply a move back to the bottom of the swing trading range which in the case of the sp500 would be close to 1040 level.
Obviously the Sp500 is an average, not a single stock. But I think the action in GE is very telling. The action in the XLF and financial stocks is also telling. A high volume break down at the topside of the trading range (without even being able to break out north of the trading range like GE did) and then today a reversal hammer and long topping tail.
JUST CLOSE DOWN YOUR BLOG AND GO FISHING. IT’S ALL AN EXERCISE IN FUTILITY
Is the Fed Boosting Stocks? The Numbers Don’t Lie…
By Jason Goepfert, SentimenTrader
Saturday, October 16, 2010
Anyone who’s read my SentimenTrader advisory over the past nine years knows I’m not a conspiracy theorist.
Out of the approximately 2,500 comments I’ve posted, I’ve alluded to market manipulation probably fewer than half a dozen times.
Whenever I hear about “evil investment banks” or “politicized Fed bankers” or “automatic trading algorithms,” my eyes kind of glaze over, I huff, “get over it,” and I concentrate on finding market anomalies to trade.
———-Advertisement———-
Yours FREE: The most valuable – and controversial – book in America
We have recently arranged for you to receive a free copy of one of the hottest books in America right now.
It has nothing to do with the stock market… but rather details one financial move you absolutely, positively must make in the next few months.
You can register for your free copy (you’ll pay only $5 to cover shipping and handling) here
———————————
But I’ll be perfectly honest here – I’m starting to crack. You see, my job is to analyze market data. I’ve done it for more than a decade. And the trading patterns I’m seeing during the day, especially lately, are not what we’ve typically seen in the past.
Last Wednesday’s trading session is a perfect example. We were seeing persistently weak readings in the NYSE TICK indicator (meaning more stocks last traded on a downtick than an uptick), and yet the S&P futures kept creeping higher at the same time. That is extraordinarily unusual.
I’m not going to spend my time looking at every tiny stock movement as evidence of “manipulators” at work. The market has always been manipulated by somebody – the story never changes, only the characters do.
But today I do want to touch on something that’s getting a lot of attention, which is the latest announcement of Permanent Open Market Operations (POMO) by the Federal Reserve, found here. This is where the Fed announces, in general, what government securities it is going to buy and how much. Many are starting to believe these funds wind their way through the system and end up in the stock market.
I’m not going to pretend I have any great insight as to whether this is true, the actual mechanics of how it would work, or what other ways the Fed might be propping up stock prices. I’m just going to take the data at face value and see what impact it has had on stocks.
So let’s use the Fed’s data on POMO days to see if the S&P 500 had any tendency to rise on those days or immediately thereafter.
The table below shows the S&P’s performance on days there were no POMO buys, and compares that to all POMO days, those greater than and less than $3.5 billion, and then by the different types of bond purchases the Fed does. The data begins in August 2005. (Don’t worry about focusing on all the numbers, I’ll tell you what it all means just below the chart.)
One thing stands out pretty clear: The market was more likely to rally, and with a significantly higher return, after POMO days than after non-POMO days.
Looking at returns one month later, if there were no POMO operations, the S&P was positive 58% of the time with a median return of -0.3%. But if the Fed was active on a particular day, a month later, the S&P was up 78% of the time with a return of +2.6%.
That’s a stark difference.
And the larger the operation, the better the S&P did a month later.
Looking at the various types of operations, the most impact seemed to be with Coupon Purchases (listed as “Outright Treasury Coupon Purchase” on the Fed’s website). And the most positive of all were large Coupon Purchases – if the operation was greater than $3.5 billion on those days, a month later, the S&P 500 was positive 89% of the time (33 out of 37 days) with a median return of +3.4%.
Looking at the Fed’s website, it looks like that’s exactly what we’re in store for during the coming weeks.
It’s exceptionally difficult for me to rely on data like this for trading decisions. Citing conspiracy theories for the basis of trades smacks of desperation. But it’s hard to argue with the data above, and the unusual way in which the market has been behaving.
Whether you believe in Fed conspiracies or not, the numbers here don’t lie. The government has an unlimited amount of money at its disposal if it wants to boost asset prices. Keep this in mind when trading over the coming months.
Regards,
Well it seems like almost everyone whether it be message board posters, CNBC other financial media, newspapers etc etc are OBSESSED with the FED and QE2. That is all they talk about, just like everyone talked about the internet being a new era so 1000 PE’s were justified.
I don’t buy it.
The FED cannot control the market with puppet strings forever. They can manipulate it for periods of time yes, but when the music stops there is absolutely NOTHING they can do to stop massive market forces.
Those who subscribe to FED QE2 religion are not trusting the price charts and instead assuming that the FED controls every tick in the market.
When the market does reverse down, it will reverse down VERY HARD with a force that is so surprising people will wonder where the FED is to help them.
Why? because artificial pumping of markets results in market forces reverting back to the previous mean value, and can sometimes do so very quickly because the previous pumping was based on artificial pumping and not real economics and market means.
The Fed was responsible for the rally from March 2009. How many chartists got burned over and over again by a market that kept looking like it was going to correct but miraculously kept going up?
They do it in the premarket by pushing up the thinly traded futures. Studies have shown that the market is rarely down in the premarket and is more likely to gap up than gap down
During market hours 50% of the volume is made of of 112 stocks. Just move those stocks and you move the market
I can see from my own observations while the market is open. Many times the market continues up relentlessly during the day even though the up/down volume ratio is going up, the advance/decline line is going sideways to down. That tells me that the general market is not going along with there attempt to manipulate it but all they need are the key stocks to move the indexes
So the best strategy would have been to ride along with their criminal manipulations and will continue to until it stops. And yes when it ends it will end badly. Overnight most will lose everything they made on this bubble and then some
I have many indicators, charts and cycle work of all kinds that say this market is not real but as long as that Obama whore Bernake is in charge we will keep going up, most likely at least into the election
I hope I’m wrong as I am net short
P.S. I am finding myself trading the FOREX market as it trades more like the stock market use to