
There are some signs of a possible short term downside reversal in the market today but we do not have confirmation yet. We also have possible signs of a weekly trend change developing but again, no real confirmation yet.
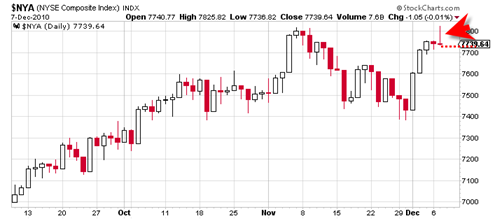
The NYSE Composite index put in a potentially bearish daily shooting star reversal candlestick today. We will need a close below today’s low to confirm it. The market has made a habit of completely ignoring many potential reversal candlestick formations, so the first sign that today’s candle reversal does not work would be for a strong and steady opening tomorrow and solid close.
But a gap down tomorrow and solid down end of day close could set the beginning stages for some type of more meaningful trend change.
My weekly chart on the sp500 is showing we are at a significant potential reversal area as well. There is a bearish triple M on the weekly MACD histogram on the sp500. But the week is still very early and we do not have a final weekly price close which could affect the nature of the bearish triple M markedly. So more data is needed but I can see potential of trend change signals here.

I may switch to a BOT Short signal in the morning right from the open if the environment looks ripe enough.
Any time a stock or index revisits the previous highs there is always the risk of a failure retest and/or a top. This shooting star reversal could also just be an intra day consolidation near the previous highs. Today’s selling reflects those who ‘bought high’ in early November 2010 and wish to break even and get out.
The high in April 2010 on the sp500 was 1219.80. If Wednesday’s trading action manages to hold above 1219.80, then I have to view that as a first sign that today’s intraday reversal was just a head fake and not necessarily a sign of a real reversal.
I thought the market showed a lot of weakness today. I intend to close out my long positions early tomorrow morning. At this point, it may just be a short term reversal, but there is the potential for a sharp intermediate reversal.
Take for example the MrClellan oscillator, it turned down today and it never showed much strength in the first place.
OK, the truth is that my gut has a feeling that the market is now due for a fairly substantial correction.
In spite of the seasonality which is typically bullish.
I tend to agree with you, especially if the US Dollar index can get its footing again and break north of the previous resistance neckline level.
However it would have been more bearish if we closed half a percent down today or more to really start sinking our teeth into previous support range.
Tom:
One of the technical indicators that leads me to feel like a correction is near, is the shooting star in the Wilshire 5000.
What do you think.
JR,
Yes again I have to agree with you. I just looked at it on stockcharts. The NYSE composite index looks about the same.
http://stockcharts.com/h-sc/ui?s=$WLSH&p=D&b=5&g=0&id=p57296434072
There is also a potential daily divergence developing between the price peaks and the RSI and MACD.
if the bearish divergence signals are meant to be then I would expect a possible gap down tomorrow straight out of the gate and persistent closing bearishness all day.
If we do not see that then the other possibility is that we trade down tomorrow and then reverse by end of day creating a bullish reversal hammer. I have seen this happen SO MANY times… we get a shooting star and then a bullish reversal hammer the next day.
Usually with these shooting stars one tends to see at least some upwards price action right into the shooting star candle the next trading day. So we may trade up into today’s shooting star candle tomorrow, but then if we see a rapid deterioration after that then look out below.
But again, I am hesitant to turn too bearish at this juncture yet.
For now I am giving the market the benefit of the doubt and suspect that today was a consolidation day right at new 52 week highs.
But the weekly MACD is in a strong resistance zone now and bumping its head up against this resistance, so change may be at hand… but we must let the wind blow a bit longer and see some more data in my opinion.
The Volatility index is trading at the bottom of a massive expanding triangle and seems also to be trying to create a weekly reversal on the weekly chart. So some bearish tendencies blowing in the wind now… lets see if the bears can tame some of this Christmas cheer.
I piled on some more Bullish bets and removed my puts this morning only to take off some bullish positions toward the end of the day. All in all a very frustrating and unprofitable day.
Well it appears that the late day sell off today was because some of the liberal members of congress are not willing to vote for the tax cuts agreement.
The technicals are touch and go so we will probably have to see how the politics of this pan out
There is a lot of bearish engulfing patterns everywhere you look. Gap up and then closing below the prev. bar low – and doing it convincingly – is never a good thing (unless you are short).