
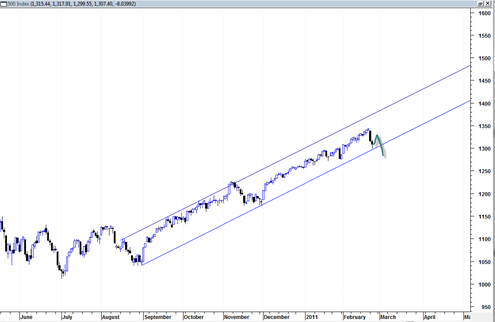
Today the sp500 blasted through 1313 mentioned yesterday and closed under it. Now we see that the sp500 is right at bottom channel support and suggests that the market moves into ‘bounce mode’ during the next 2 to 3 trading days.
I suspect that this bounce will not immediately materialize into new 52 week highs as was the case with previous mini corrections. On the contrary, after this bounce there may exist a good short opportunity.
The daily MACD is on sell mode but I think the market will ‘fade the sell’ during the next several days and move up to create an A B C down type pattern.
Key is the channel support range. If on the next attack of the bottom channel line we see a break through to the downside then it would open the door to a longer more complex correction. But if channel support holds then one has to presume the power trend will continue higher again.

The trading channel since early September 2010 has been very powerful and very persistent and working for quite some time now. Testing channel support again without breaking down through it could give the market an added does of confidence in the weeks ahead as it would be the third touch of the bottom channel line. Better to keep an open mind than presume a total break down in the market at this point.
This symmetry in the sp500 post I did a while back seems like it is playing out. The number of bars on the right side were greater than on the left side, but they were pretty close and seems to suggest we will get more than just a several day type correction this time around.
This is the channel I’ve been watching too. On first touch, expect a bounce. How far the bounce goes will be telling which in turn would depend on if and when market will discount libya’s oil impact.
Do you do e-wave counts too?
I don’t know enough about elliottwave to do any wave counts, plus they tend to give me temporary brain damage since one never knows what wave you are in and then have to change it at the worst possible time.
I would look at 1327 on the sp500 as a max target for upward retracement since that would be the 61.8 percent retrace of the decline so far. If we blast above 1327 then it may at least start to put some doubt about the power of this current down trend.
I concur with you analysis. However I see the last two days as a giant bear trap. As the rebound begins to look real, the bears will come in cover their shorts. An up, up we go.
Question: How long do you think it will be before we see a U.S. military move into Libya. Wow, what a great opportunity. It is the oil stupid. It is almost like this whole thing was planned and when you start to count the oil chips, the U.S. will be the table leader. Two more players drop out. Sadam and now Gaddafi.
Your guess is as good as mine as far as Libya action. It could be that Europe and the USA wants to go in there and create a no fly zone. Maybe that would be good for 200 DJIA points up .
Will be interesting to see how we close February.. I am seeing some very bearish looking monthly shooting star reversals all over the place right now. If we close them that way next week it could suggest we are in for a few months of more correction at a minimum.
Just my opinon, watch the 50day and anything under the 13day is bearish in my view. I agree that the channel above has def been working well thus far.