
In yesterday’s post on the sp500 it seemed as though we had a clear intraday reversal at hand and an easy chance at higher prices. I did mention in yesterday’s post that, “A down market tomorrow that retraces and closes more than 50% into today’s reversal hammer would potentially eliminate today’s move as a clear pivot point to go higher.” This is clearly what happened today and caused me to step back and say ‘whoa!’. I do have to admit that my bullish comments yesterday were a clear mistake. Congrats to Ed, one of the comment posters at BestonlineTrades for making key bearish observations recently. There was another comment poster who also made a key bearish comment on AAPL and the gold price that it could be forming a head and shoulders top but I forget who it was.
In hindsight the NYSE summation index and the daily MACD were clearly in sell mode and deserved greater respect than yesterday’s one day reversal. The NYSE summation index is now in the most bearish stance with the RSI of the summation index at 18.74 and at similar levels where the biggest declines have occurred (ie. May 2010).
I failed to highlight 11/16/2010 down price swing in any of my commentary over the past couple of weeks. This was a very important price swing because on the SPY it was on 300 million shares. That was the first high volume down swing we have seen in quite some time near this topping area. I should have gone into more discussion about how that high volume price swing could easily set up an A-B-C down leg based on the recent 3 day very low volume upside rally.
This now appears to be the case. That we are creating an A-B-C down leg with the B to C leg about to engage either this week (only 1.5 trading days left in this week) or next. I am still doing more analysis on this possibility and there is still some confusion as to whether or not we will be able to bust below the 11/16/2010 high volume swing low since today’s down volume was relatively mild.
But it does appear that the market is pivoting and attempting to get some type of downside washout type move.

Closing ARMS index today was in the 2.8 to 2.9 range which is the highest closing reading since late August 2010. If you note the chart above we see that closing ARMS readings have for a long time been contained in the ‘no fear’ yellow shaded range areas during September, October and November 2010 and also during March and April 2010.
But then there began a higher surge of closing ARMS readings which started to break the foundation of the market (red shaded section). In late April 2010 this was a kickstart to a much deeper correction. It could very well be that the recent two closing high spikes in ARMS readings are the kickstart to a more serious decline phase.
The Very Bearish Monthly Setup
There does now currently exist a potentially very bearish monthly sell setup in the sp500 and the other major indices. The sell setup exists going into the month of December due to a possible ‘shooting star’ or reversal hammer formation in the November 2010 monthly candlestick. There are only 3.5 trading days left in the month of November 2010. That is not that much time to reverse this potentially very bearish monthly shooting star candlestick. It looks very bearish to me especially when taken in the context of the sp500 failing to get a continuation breakout above the April 2010 highs. A shooting star showing itself near a previous crucial peak is never a good sign. It could mean a very hard down first two weeks of December 2010. The seasonality factors seem to refute such a possibility, but a close in the sp500 near 1181 by Tuesday of next week is going to keep the bearish potential alive.

The chart above shows many monthly shooting star reversal candlesticks since 1995. The May 2010 collapse was preceded by such a candlestick and also the kick start to the 2008 drop also started with such a candle. The 1998 collapse showed a similar candle. There were several that did not work including the 2003 and 1996 time frames.
The first sign that this monthly sell setup is working properly is if we see rapid continuation selling start next week after the holiday and perhaps part of the week after as well. If we see ease of movement to the downside starting next week then it warns that the November 2010 monthly shooting star candle is working.
The XLF financial ETF looks like it has done a clear failed topside breakout above its long trading range. A break below 14.19 warns that it could move back to the bottom of the range near 13.30.
Up Rest of This week and then Down Next ?
Despite the drop today it seems reasonable to assume some type of upside bounce into end of this USA holiday trading week. That would only leave 2 days of November starting next week and then some type of downside continuation the rest of next week.
The recent news on Ireland and North Korea may be too difficult for the market to shrug off right away. One cannot help but think that the Ireland situation has the potential to snowball into something bigger affecting the rest of Europe. And the North Korea situation, while currently not a ‘major panic news event’, has the potential to turn into a major fear factor.
In the long term stock markets always seem to recover from war situations and rally strongly higher, but it is the first phases of these potential new wars that seem to do the most initial damage to markets. And markets that are already extremely overbought can be especially vulnerable to ‘new war news’.
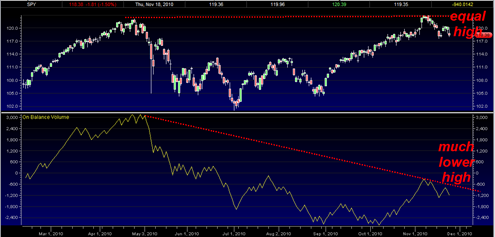
Ominous Looking On Balance Volume on SPY
Here is the On Balance Volume versus the SPY ETF chart again and it continues to show quite an ominous looking bearish divergence. The On Balance Volume has failed to confirm the SPY equal high ‘by miles’.

At this point I think there are more risks of downside price action than up. But I am still skeptical that any dramatic move would come by the end of this week.
I am looking for confirmation that the November 2010 monthly shooting star candle is going to have some real firepower (a signal of 1 or 2 heavy down weeks to start December 2010) going into next week.
Tom
thanks for your post and all the work that went into it. it is curious that the EWer “pug” has not yet posted his daily public post which may mean that today’s action was sufficiently errant that he will change his view. it is interesting to note that IF november closes with the bearish inference, in many cases there is still time to get bearish (or more bearish) and earn from it. thanks
Hey Geoff et al:
Don’t switch yet. Studying the Wilshire 5000 all I see is a three wave pattern, with an (a) peak around 11/17-19 then the formation of a (b) down wave 11/22-23 anticipating an upward [c] wave starting in the next few days taking the Wilshire as high as 12,900.
Of course I am prejudiced since my OPEN has been doing so well. Today in a down market, OPEN climbed 2.88%. As the shorts get squeezed in OPEN, this stock has a potential 15% move in a very short time frame!
I really think the algorithm boys are playing with the market. Looking for the shorts building potential energy for an explosive move upward.
This N. Korea rationale for the down today is pure BS. The North is totally controlled by China. As she has been for the last 2000 years. The North is looking for some form of accommodation from its rich sister the South which will substantially improve its economy.
Ultimately both N and S look to be unified. That is their heritage. The South (yes the South) wants the North to be economically much stronger before a unification can occur. I think the South is complicit in this whole thing!
So blaming the Korean situation on the slide today is a red herring.
As to the Euro situation, this is an inherent problem with independent countries not having their own individual central banks and separate currencies!
We have a collection of totally different economies. Not one unified whole. The Europeans need to rethink the Euro structure. It is possible the whole concept simply does not work. But that said, that will only represent an opportunity for the World’s most powerful Country.
Worrisome for Europe, opportunity for the U.S. Particularly the big U.S. Banks. Do I note accumulation in Citi? The smart players are waiting for the U.S. liquidation of its Citi position, then Citi along with its big sisters will all start their move up as they drool in anticipation of the Euro collapse.
So forget the Euro rationalization!
The action today was simply the Goliath algorithm boys manipulating the market!
the incredible divergence of the on balance chart is extremely compelling for bears, the situation in Washington is a mess (taxes etc) and globally a mess as well BUT seasonally, this would have to almost be a once in century event for market to collapse in December. my guess is that bullishness gets more stretched with side ways or slight upside and IF a down draft it is postponed until January. . . . however the January 2010 indicator was for a down year in 2010. . . so maybe the unthinkable will happen. boy, my dithering does not make for decisive investing.
i would not be caught dead in OPEN on the long side. . . may the force be with you! plse post when you have sold your long position. . . . no post, and will assume you got caught in the fall off the cliff
Wow, I had not seen the OBV. That looks really bad.
I have predicted a head and shoulder for AAPL a few days back (elsewhere) and I think it is coming true.
For the less bearish of us, can you do a sector analysis… there should be some things that are working.
Geoff:
I closed out my OPEN position today at 75.14!
There is an old saying bulls make money, bears make money but pigs never do.
Traditionally, the market has a sweet spot from day before thanksgiving to the day after.
Possibly I should have waited until close to the close on Friday, but with almost a 10 point gain, I felt it was time to take my profits.
So, in compliance with your request to let you know when I closed out my long position, I though I should give you a heads up.
Happy trading and happy thanksgiving.
I switched into a small trade (less than 5,000 shares) of LVS, long @49.88 for a short trade. Out Friday!
well done JR – – – you are a much better person than me – – holding OPEN was like holding on to a grenade with pin pulled
Geoff: Interesting isn’t it. If you check the time stamp on my comment you will see that at the time OPEN was around 76. up a point from where I sold. But now it is at 70.37. Down over two and a half points from the close. That is quite a swing!!
It just goes to show that in the stock market you need to be not only smart but also lucky.
Have a happy thanksgiving.
JR – – don’t break your arm before the big feast
Geoff: Actually, I want to thank you for keeping me on my toes. You are right had I fallen asleep, this play could have easily blown up in my face.
Thanks