
There is some risk to the short side from here. I was thinking about switching to a BOT Long signal today in the AM but held back.. But that my very well have been the right course of action. But I would rather wait another day or two for confirmation.
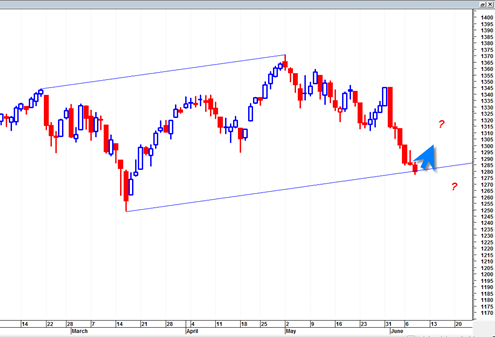
We appear to be bouncing off of a large diagonal swing trading range in the sp500 and at this time it is unknown if the channel trading range will hold or be busted. If it does hold then it could mean quite a significant northward follow on move that could see the market rally for some time and put more significant declines in hold.
We did come down quite a bit to oversold range on RSI and hit a low of almost 30 on the daily relative strength index.

The chart above shows two perfectly parallel channel lines that define a large swing trading range for the sp500. Put simply, if the channel holds then it is short term bullish, but if busted then it is short term and intermediate term more bearish.
It has been rare for the sp500 to trade down 6 straight days in a row and so now we have to see what kind of bounce or sustainable bounce the market can deliver for a better gauge on the ‘staying power’ of the current ‘mini bear market’.
do you read your own posts? do you read the last two posts for example?
out of sheer curiosity, i will be reading your first post after 13th June – “the” swing date ending an 8.6 year cycle. i only have a couple trading days to wait! it is incredible that the original “rapture” date of May 21st was so close to 13th June. and than we have the Mayan End Cycle Date in 2012 which you very recently referred to, but got it in the wrong year.
i am glad that you are turning bullish, it helps have conviction to stay the short / bear course.