
The sp500 today continues to power higher on seemingly endless amounts of good news. A buy signal was confirmed based on the MACD histogram today as we closed above yesterday’s high. Volume ticked up today as well on the SPY ETF. It appears now as though the sp500 is on a mission for 1219.80 which is the April 2010 highs. For now I view that target as simply a matter of ‘when’ not ‘if’.
This is not a market to short right now in my opinion. The market has evaded many traditional sell signals given the by VIX, summation index and individual candlestick patterns. The very large series of candlestick patterns in the recent few weeks have not been able to be confirmed. Instead their proper interpretation was that they were simply pausing points for the market.
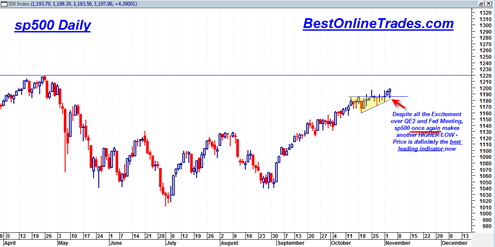
Assuming the sp500 continues to the April 2010 highs, I am looking for a break through and then a retest assuming a successful breakout. Then I expect a possible continued surge onto new ground as November starts to unfold.

I expect there to be corrections, but I think they will be extremely difficult to catch and only offer limited duration and depth in terms of downside. This market has shown us its character is now one that is willing to go into a correction, but it has a tendency to do so by limiting the downward price slope and instead moving more towards a horizontal tendency. That type of price action can move oscillators and indicators into oversold conditions but still leave price integrity relatively unharmed.
The XLF is a good example of an ETF that has basically done nothing since mid September 2010. It has traded sideways relentlessly. Today it started trending higher on a surge in volume. It could very well be that the XLF is ready to bust out north from its long trading range. In fact this is looking quite likely to me now given some strength I am seeing in some individual banking stocks. The verdict is that the XLF is likely going to be dragged higher by the other indices. It will likely play ‘catch up’ similar to the way the SMH semiconductor index has done recently. The XLF actually looks like a promising long trade from here.
The price action reminds me a little bit of the 2003 2004 period where the market succeeded in pushing relentlessly higher and only offering meager corrections and then only limited ones when they came due.
This is not looking like an environment that is ripe for shorting. That is not to say there will not be individual short opportunities out there in individual stocks, but my take is that shorting the indices between now and end of year is the wrong way to go.
The next great extended shorting opportunity is going to exist when the weekly MACD and the monthly MACD are in bearish stances. That pre condition is likely going to take a long time to evolve given how slowly these indictors move on the longer term time frames.
I’m afraid I’m going to have to add you (in this case contra indicator) to my list of indicators and studies that are telling me this rally is long in the tooth. Looking at price, yes this market looks strong and yes this market is rigged to go up by the Fed, but I will be looking for the market to falter starting tomorrow.
Why is tomorrow so magical for a top? I agree with you we are over extended and in dire need of a downside reaction. See my post on the NDX 100. It might start from that juncture.
Hanging man candle on all four major indexes for a start, including their ETF’s SPY, DIA, QQQQ, and IWM