
The sp500 needs a close below 1070.66 to confirm a MACD histogram sell signal. We are under that level right now and show confirmation, so the bears need to keep the market ‘down enough’ by end of day to get the job done. Will they get the job done today? I think they have a good shot at the getting the job done for a change :) Downward momentum and volatility should start to increase dramatically next week.
The WEEKLY Russell 2000 index is showing a very ominous and bearish looking gravestone doji candlestick right now as I write. If this weekly candlestick in the Russell 2000 confirms by end of day today then it is going to imply in my opinion some very hard down price action next week, probably right into 26 August.
Last weeks candlestick close in the Russell 2000 was quite bearish looking as well. Showing a wide range body and close near the lows. So clearly this was a sign of weakness. This week we tried to rally but so far failed and now we are printing a gravestone doji. So as far as I am concerned any upside price action for the rest of today is simply noise and distracts from what I see as the beginning of a nasty leg down in the market.

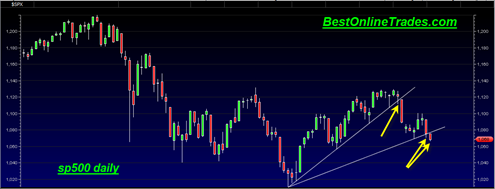
In the sp500 chart above you can see that the uptrend since July 1, 2010 was at first briefly pierced with the tail of small candlestick. That was the warning sign that a break would come eventually. It did. Now we have traded down again and today broken below what could have been another uptrend support area. But instead of acting like support we busted below it today. That is not bullish action at all. The bulls should have been able to hold the lower trend line today to keep a remote chance of a picture of market strength. The trend is clearly down here as I see it. Next week is going to be very interesting for those on the short side of this market in my opinion. . .
Tom
if you believe in astro, i believe in you as a contrary indicator. since i am a bear, i sure do wish you refrain from posting until after the market closes. your assumptions are too frequently wrong.
Wouldn’t the gravestone Doji on the RUT weekly would be a bullish signal?
on the weekly it should mean bearish but it is unconfirmed. need a weekly close below it next week.
Elliot wave predicts a move on Monday to the 1085-87 range then a hard wave (iii) down! Possibly late Monday or Tuesday. Very Bearish!