
The sp500 today did a more meaningful decline than what we are used to seeing. We have gotten used to the sp500 going up in a straight line with zero down days, so today was definitely something different to behold.
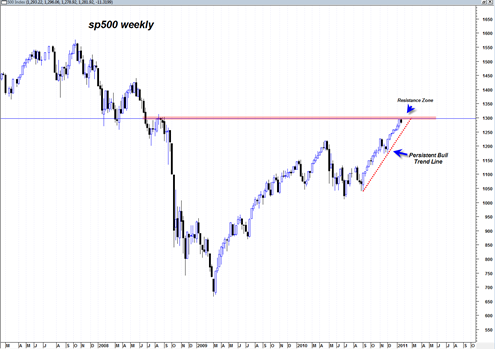
Today’s decline seems consistent with the sp500 getting close enough to the all important 1300 resistance zone which I mentioned on a few other occasions. This resistance zone was built during August of 2008 right before the famous mega plunge of September and October of that year.
So now we have a sell off developing right off of this zone and it could imply that we are in for a more involved correction.
Notable today however was the speed with which we hit a high ARMS index reading. Today I see that closing ARMS hit a closing value in the 2.4 range which to me is quite high on the first decline right off of the top. When I have seen ARMS zoom that high on the first decline off of a top it usually means fear surges into the market very quickly which can halt the decline just as fast in the near term.
If we get follow through to the downside tomorrow then I am expecting the decline to be halted in the sp500 at a daily RSI (relative strength index indicator) level of 59 as there is a support zone there from previous declines. It could very well be that today’s decline was the majority of the decline already. We will just have to wait and see if there is any follow through tomorrow.
Of course there is always the risk that a near term decline evolves into something much more involved. We have 8 trading days left until the end of this month which would put the finishing touches on the January Monthly candlestick. If we find ourselves by the end of hte next 8 trading days near 1256 or lower on the sp500 then that would definitely be a sign that this correction is possibly going to stick much longer as it would show a quite bearish monthly shooting star candlestick or other bearish variations.

Also worth pointing out is that we have still not created any bottoming tail on the monthly, quarterly and yearly candlestick. If market is strong enough then it will continue to evade creating such a bottoming tail for the duration of the next few months.
We hit and bounced off the upper limit of the rising wedge on the daily SPX (1295-1300). I agree that two high TRIN days in a row usually leads to a reversal on the next day. I think that if we have a down day tomorrow and then for a third day, we could be in for a sustained decline.
Here is an article on the potential decline
Top market-timer DeMark:
A BIG stock market decline is about to begin
Wednesday, January 19, 2011
From Bloomberg:
U.S. stocks are within a week of “a significant market top” that is likely to precede a drop of at least 11% in the Standard & Poor’s 500 Index, said Tom DeMark, creator of a set of market-timing indicators.
DeMark’s Sequential and Combo indicators, designed to identify market tops and bottoms, are giving a sell signal on the main U.S. stock benchmark for the first time since mid-2007, he said in a telephone interview. The S&P 500 began its 57% plunge from a record in October 2007.
“I’m pretty confident that in one to two weeks, the market will be in a descent,” said DeMark, founder and chief executive officer of Market Studies LLC. “It could be pretty sharp.”
DeMark’s forecast follows projections from Wall Street strategists that the S&P 500 will climb to 1,384, an annual gain of 10%, through the end of the year, according to the average of 12 estimates in a Bloomberg survey. Short selling of companies in the index has fallen to the lowest level in a year, according to Data Explorers, a New York-based research firm.
Steven A. Cohen, founder of Stamford, Connecticut-based SAC Capital Advisors LP, which manages $12 billion, and John H. Burbank, founder of San Francisco-based Passport Capital LLC, which manages $4.2 billion, are partners in Market Studies, DeMark said. The firm has its headquarters near Scottsdale, Arizona.
‘Conservative Estimate’
On a weekly basis, the two indicators signaled on January 14 that a reversal is imminent as the S&P 500 closed at its highest level since August 2008. DeMark expects a decline of at least 11% because his work shows that markets move in increments of 5.56%, he said. Assuming a drop twice that size is “a conservative estimate,” he said.
The indicators are based on comparisons of the current closing level of the index with closing and intraday levels over previous periods. The reading January 14 was the first signal of a reversal in the S&P 500 since March 2009, when the indicators showed a rebound was imminent, he said. That month the S&P 500 fell to a 12-year low from which it has rebounded more than 90%.
The index has risen for seven straight weeks, the longest stretch since May 2007. The S&P 500 rose 0.1% to 1,295.02 at 4 p.m. in New York.