Yesterday’s reversal hammer candlestick on the sp500 had a high price of 1320.71. Today’s close was 1320.68. So technically speaking the reversal hammer candlestick of yesterday was not confirmed today. However I will say that after hours the SPY ETF is already higher so it may be safe to presume that the reversal hammer candlestick is going to be a confirmed one.
There are several crosscurrents both in the market and in my mind at this time:
- The UUP ETF continues to blast higher in slow orderly fashion today. So it would seem this could be a problem for the US indices if it continues. But so far the USA indices are holding their ground today and seem to want to head higher in the short term.
- The Sp500 could be described in the last 5 days as having formed a bearish looking rising flag formation which would have quite bearish implications if we get a confirmation of the bearish pattern and a measured move to the downside.
- The current advancing volume on the SPY of the last 4 days has been horrible relative to the declining volume that led to this decline. BUT the problem with this analysis is that this has been the case out of almost every recovery from a bad correction since 2009. It has been happening since 2009 and look how much higher we are today versus the March 2009 lows.
- Commodities continue to act weak.
A case can be made that the sp500 is currently forming a 4 to 5 day bearish flag formation. If true, and if confirmed then it could mean an eventual move towards 1220 range as the symmetry second leg of the down move. But my sense right now is that this will not play out and that we are going to continue topside again.
The UUP is a bit of a wild card. There is a potential short term bearish divergence that could maybe send the UUP down hard perhaps on some better than expected economic data tomorrow. A strong up day in the USA markets tomorrow would go a long way towards building the case that the market has bottomed for now.
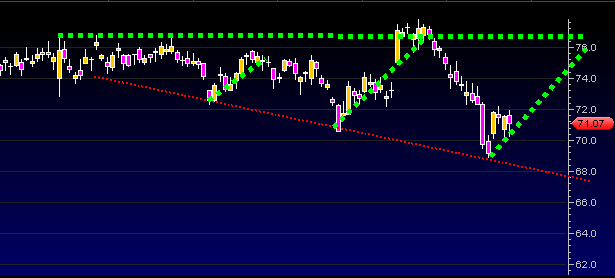
If you look at Boeing, one of the DJIA stocks you get this sense of what is going on with the individual big names. Of course they do not all look like this but a few of them do. It speaks to this ‘rolling’ type of correction that appears extremely bearish but it merely takes the form of a broadening wedge formation which is a corrective formation. My read of this type of corrective formation is that it is simply a working off of overbought levels through a series of deeper corrective valleys. The key point of the pattern is that it does not end in a total collapse.
Look at Boeing for example:

It has a clear symmetrical corrective formation and not it looks like it wants to go topside again up to the top of the range.
I should also mention General Electric GE stock. This saying goes, “so goes GE, so goes the Dow”, meaning that what GE does we generally see the DJIA do eventually.
So looking at GE we see that it has held its composure through this correction and now actually appears as though it wants to go topside again.
GE has held up quite well during all this month of May mess of a correction and it actually looks to me like it is warming up for an upside big move given that it has essentially been going sideways since the beginning of this year.

Finally, putting all technical analysis aside, this is an election year. I remain quite suspicious and doubtful that the USA is going to plunge into a recession the second half of this year. ‘They’ have every incentive to keep this market afloat until AFTER the election and the market could be thinking the same as well.
The bottom line?
The bottom line is that this market still looks like it wants to move higher, the correction may be over and it may have just been the typical ‘sell in May and go away’ type correction. Rephrased it is probably more of a “sell in May and go away, and then come back after May to push the market up again into the election”.
The wild card is the UUP ETF as traditionally a surging US dollar index is trouble for the USA markets. We will have to see if the recent move in the dollar was simple a ‘ghost’ type move up and can let the USA markets continue higher. Sometimes a rising dollar does not really equate to a day to day 1 to 1 relationship with the markets. Sometimes it creeps up slowly and then only after it surges higher do we see a real reaction from the stock market.
