
The sp500 has once again printed today another indecision candlestick, a long legged doji. We now have quite a large cluster of these indecision doji’s and other candlesticks that so far are only really saying that we have reached a pause in the up trend that began in early September 2010.
At this point I think it is still wise to rely on price itself as the leading indicator. I can tell you that the NYSE McClellan summation index, the daily MACD and several other indicators are saying the sp500 should turn down by mid week this week.
But I can also counter these sell signs with the simple observation that despite all the recent dojis and other potential reversal candlesticks, price is still making higher lows, but not substantial higher highs.

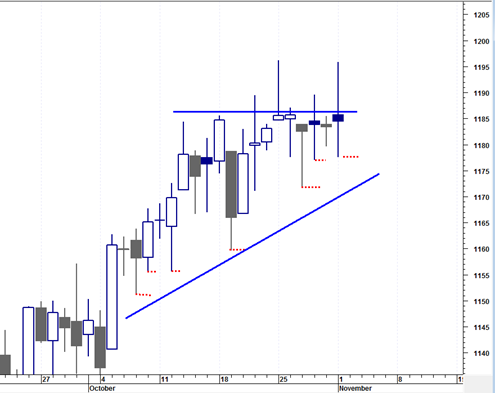
The pattern of the recent few weeks of price action in the sp500 seems to resemble that of an ascending triangle which depicts a condition of rising demand meeting a large seller until eventually the seller may be overtaken.
We did not get a close under 1176 today that I indicated would start to form a break of the small ascending triangle pattern. We did bust above 1190 today but did not succeed in closing above the 1185 range. So at the end of the day there is still doubt in the picture as to the next major direction for the market.
The simple observation of the higher lows (indicated by the small horizontal red dashed lines) is saying that we are still in an uptrend, despite the recent confusion.
I am still keeping the BOT short signal intact, but will change it to long signal if by Wednesday of this week we can get a decisive upwards break above the recent range.
We have a confirmed monthly MACD histogram buy signal now with October 2010 being such a strong month. That does not mean that we cannot get a downwards retracement. We can. But it says to me that the longer term bull trend (that began in March 2009) is still looking pretty healthy right now.
I am not all in on the short side but I have taken substantial positions, shorting OPEN, RSH and NBIX.
I realize that this is a pick em but looking at the various golden crosses, I have concluded a golden cross does not mean that a move is going to happen the next day. I sometimes takes weeks for it to happen.
As a side bar: I notice the McClellan summation index and oscillator look quite similar to the way they looked back in April. The summation indicator is showing a nice turn down and the oscillator, has been oscillating around the zero line. I think the summation indicator is the canary in the mine.
I have already commented on my other technical indicators and I will keep quiet and see what happens.
I don’t expect a lot of action tomorrow.
well, you should get some action in OPEN tomorrow after the close. . . they report earnings. i have a few puts so i am on same side as you. here is hoping.
Just looked at OPEN. Must admit it does look quite bearish.. Had a break down on heavy volume and then the recent week or two of low volume reaction.. and then the weak close today. Nice find guys.