
The Arms Index today closed at an amazing number if you are superstitious. It closed at 6.66 according to my data provider. I am not going to go into the superstitious aspects of that number but I will say that on a very short term basis the market is deeply oversold. This was the highest reading since 6/4/2010 record high closing value of the TRIN and before that it was the highest reading since 2/10/2009, quite a long time ago.
The volume on the SPY ETF today was 273 million shares which is a dramatic increase from the last few weeks but still not of the level that I would consider it panic volume. In fact the steady declining volume trend in the SPY since the April 2010 highs still shows this pattern even after today’s mini flash crash.
So the very high closing TRIN today tells me we get a one day bounce higher tomorrow to work off some of this short term oversold condition and get back into the range of today’s 20/20 candlestick bar.

I think it is very telling that today we did not get down below the 7/30/2010 price hammer candlestick low of 1088.01 We had all this price destruction today, the high ARMS index reading wholesale dumping of almost everything and at the end of the day the bears could not even push us down a little bit more to break the 1088.01 swing ? (red dotted horizontal line) Hmmmm. It bolsters my short term take that we bounce higher tomorrow within this somewhat larger rectangle.
By the way, despite today’s up trendline break, the bulls could still make the case that we are now forming the handle of a cup and handle pattern. The depth of the cup would be the July 1, 2010 low and the handle would have started to form about 8 days ago. If this is true then ideally one would not want to see the handle of the cup and handle break below today’s low.
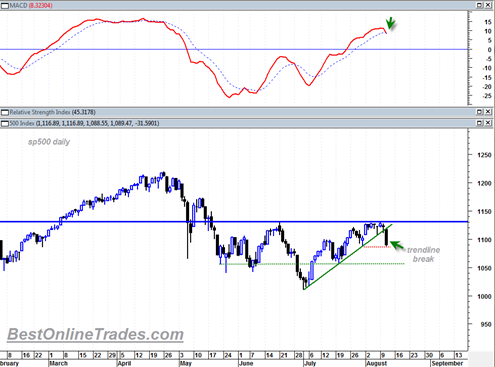
If the cup and handle theory does not work out and we do continue to break down and through 1088.01 on the sp500 index then it looks like 1056.88 is quite strongly supported and the area that ought to be watched very closely for signs of demand.
Why? Because if signs of demand show up once again at that level it will mean we are going to take another shot back to the top of the recent trading range and will stay still trapped in this long frustrating trading range.
Only when price is able to bust out with conviction on either side of this large trading range can we say that a new trend is at least possibly starting. Anything that happens before that event is cause for doubt about the markets true direction.
The most bearish scenario I can think of is a doji gap down that trades below the small red dotted horizontal line in the chart above tomorrow. Then, a massive wide price candlestick follow through on Friday or Monday that blast through the long support line (green dotted horizontal line). If we are going to get a break down through the bottom of this trading range then that is how it should be accomplished, because it will need a lot of force and energy to get through there.
If we see slow sloppy action that drifts down to the bottom of the range again with bottoming tail candlesticks then it is going to warn about an inability of this market to bust the downside again.