
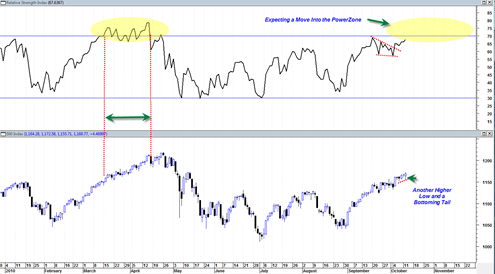
Today the sp500 hit an intra day low of 1155.71. This was once again a move into the supporting range of 1150. The sp500 once again today rejected this range and closed higher, signaling more upside to come. It appears as though the sp500 will be able to jump over 1170 which should imply an eventual test of the April 2010 highs. Today was the 6th consecutive close above the 2007 3 year bear market channel resistance line.
I am currently speculating that the sp500 will move into the RSI power zone above the 70 range at some point in October. It is also possible that we could remain in the powerzone for a period of time somewhat similar to the behavior of the sp500 during the mid March to mid April 2010 time frame. During that time frame (yellow highlight) the sp500 ‘trickled higher’ in a slow cumbersome fashion creating a series of higher highs and higher lows for one full trading month.
BestOnlineTrades currently believes this could happen again and it may once again last a full trading month or longer. It depicts a potential scenario where one sees new shorts entering the market (top picking) and then having to repeatedly cover shorts after the market trends slowly sideways and then starts trickling up again. Obviously this is not a profitable endeavor. Shorting a market too early can indeed be quite costly. And currently my longer term charts are suggesting that an extended bearish trend in the market may be quite a while away into the future.
The greatest risk to shorting the market is not a potential move from 1170 to 1215. Rather the greatest risk of shorting is getting caught in a price print over 1215 which could potentially create a very large short covering continuation move. In 1975 it led to an enormous upside monthly candle.
Try to imagine if you will, several thousand stocks that have been consolidating sideways somewhere between April 2010 to August 2010. Some of them have consolidated longer, some shorter durations. The stocks that have consolidated for much longer durations have more ‘potential energy’ for a follow on upwards move than the shorter consolidations.
So now imagine a good portion of these stocks start to slowly cascade upwards back to the top of this extended sideways trading range. If enough stocks get to the upward channel boundary line and then eventually get a northward breakout, it can lead to a huge short covering advance. Why? Because the stocks have been trading in a range for so long that it leads to a large build up of potential energy or cause for a large northward breakout if it is eventually successful.
Every stock is different. But I have looked at enough stocks over the last 6 months to get a intuitive sense that many of them are poised for a northward move and likely topside breakout. The more of them that move closer to the top of the range and get into breakout mode, the more bullish it will be for the market averages.
IBM is currently a pretty good example of this. It has been going sideways for 9 months roughly and recently has shot higher in a breakout that seems almost unimaginable in terms of how it has been able to just keep going up almost every day with barely any pullback. The reason for that is that it has the benefit of 9 months of sideways cause to use as fuel for the recent move.

I think one of the most difficult aspects of following any stock or market index is being able to overcome the bias of recent market action. The market has been trading volatile and violent since April 2010 and if one is not able to ‘step outside’ of the markets recent action (by studying the much longer term time frames) then there is the risk of becoming excessively influenced by the markets past moves.
The context of any market move in the longer term time frame is crucial for better perspective on how bearish or bullish a recent time frame move actually is. I do have to admit that I was heavily biased by the market action between April 2010 and August 2010 because of its extreme volatility. In particular the May 6, 2010 1000 point drop caused me to become particularly biased. It was only after price had repeatedly failed to break the lows that I built up the courage to see the light on the other side.
The upside volume continues to be quite average. The problem is that low volume upside moves can continue for an extended period of time, usually much longer than one originally anticipates. If the average upside volume does not start to dramatically increase soon then at some point it will likely become a problem again ( in terms of being able to continue higher). But for now the path of least resistance appears to still be on the upside.
P.S. I am placing the BOT sp500 Index Trading Signals Chart on a separate page of the site going forward.
Has anyone noticed we have another bullish confirmation in the $VLE Value Line Index which is also displaying a golden cross.
Thanks for pointing that out JR. I had not noticed it.