
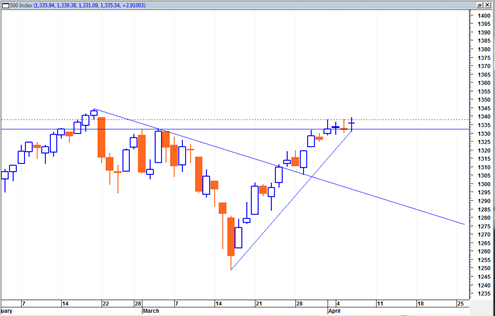
The sp500 during the last 3 trading days has printed three doji candlestick formations. For now I suspect that these three dojis are just a simple pause in the up trend. There has so far been now hard down reaction after any one of these dojis.
I have seen several dojis like this cluster before and at least in recent memory a lot of them have simply meant a pause in the trend describing a pattern where prices imply drifts sideways to rest and then finds the uptrend for a new move higher.
The Russell 2000 is already well into new high ground, the DJIA is trying to push to new highs and the sp500 is slightly under the old 52 week high.
I do not see anything immediately bearish about the McClellan summation index at the present time.
I can see the Russell 2000 supported on a pull back to 838 and the DJIA on a pull back to 12260. The sp500 is still trading above the near term support of 1332 now. Ideally for the near term continued bullish case it would keep trading above this level either sideways or only slightly down.

If I was forced to give a prediction on the next move of the sp500 then I would say it looks like it is almost ready to ‘jump the creek’ above the red dotted horizontal line above. The sp500 needs to get a close above this red dotted line to confirm the weekly MACD histogram buy signal. So far, no confirmation on that yet.