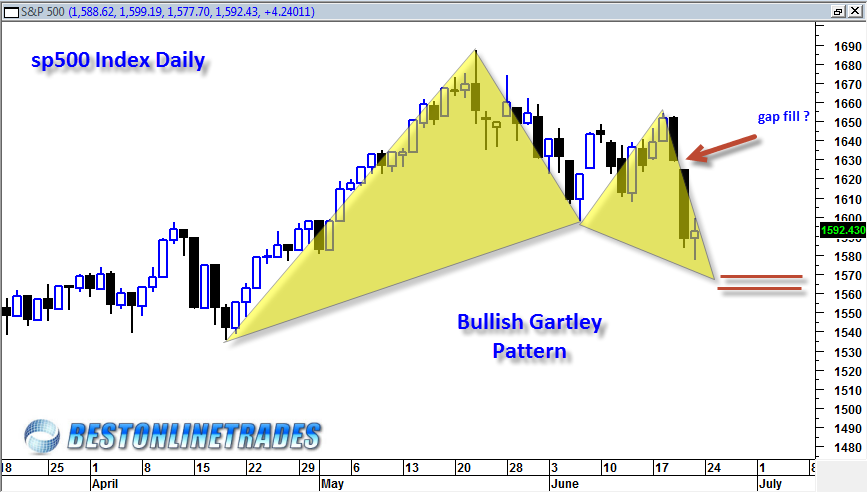
The sp500 is showing weakness as we approach the end of the second quarter. How the sp500 finishes the second quarter ending June 2013 will be an important guidepost as to what may be in store for the sp500 in July August and September 2013.
So we have 5 full trading days left in the quarter. The short term price moves seem to suggest that the sp500 could bounce north next week as an attempt to fill the large opening gap of June 20th, 2013. A bounce from here would be quite a normal occurrence. The market needs to decide however if it wants to do ‘normal’ from here or move into a faster more bearish stance and instead create only a very weak bounce and then finish next week even lower. If it does finish lower next week then it will have successfully created a quite ominous looking quarterly reversal price candlestick.

In the near term we see a bullish gartley pattern in the chart above which has reversal potential between 1563 and 1568. This pattern seems to suggest that a bounce will occur for most of next week. There are a couple important points to consider when looking at this gartley Fibonacci pattern above. First, any fib reversal pattern can fail. So the above pattern has bullish potential, but it would be considered a failure if we see decisive price action that runs through and below 1563. Sometimes these reversal patterns only lead to minor bounces and then we see a resumption of the bearish trend. So one might see a bounce to 1610 or so, but then a quick and sharp reversal that breaks back down below the low of the pattern.
This pattern is all about potential, not certainty. It is important to watch the price action carefully near the reversal zone of 1563 to 1568. If we do not see price telling us it wants to bounce hard then one has to start to consider that this pattern will fail and lead to lower prices below the pattern. When bullish reversal patterns of this type fail and price breaks below them, many times the type of break down can be quite sharp.
The June 21st, 2013 price action almost looks like a reversal hammer but it is somewhat suspect and on some other indices looks more like a doji candle. If we interpret it as a doji candlestick then we have to wonder if this doji marks the midpoint of the previous decline which can be a common occurrence. The follow on price action would stop near 1550 to 1540 if we do interpret today’s candlestick as a midpoint doji.
So I think one really has to see some early upside action to start next week to keep the bounce case alive and a strong Monday up close above today’s high. If we do not see that by Monday and at the latest Tuesday of next week then the more bearish possibilities start to become more plausible.
A close near 1540 to 1550 of next week would be the most bearish type of quarterly candlestick close I can imagine at this point. Lets see what the market pitch is next week.. stay tuned.
