Today was yet another interesting day in the market. I went short the XLF near the close with a bunch of put options and also went long the TZA again. The bears in my opinion won the day. We continue to see a market that keeps doling out positive news and yet the market continues to sell the news. The more you watch the tape action, the more you can see how the picture is building more and more bearish.
I was at the tipping point today. Had the market been able to get a solid daily close today perhaps mid price bar range or higher, then I would have held off and given the bulls the benefit of the doubt. I then would have had to be open to some more upside into the end of this week. But honestly the bulls should have been able to close us 150 Dow points higher today or even more. They just cannot get the job done despite all this good news.
So now we have bearish looking reversal candles all over the place. But they are not just bearish reversal candlesticks, they are bearish reversal candlesticks that are sitting right at the LAST edge of necessary support that the market needs to hold. If it does not hold then it could lead to acceleration down.
So I am still bearish, but I have somewhat moved away from the camp of a crash or extremely fast and violent one day huge moves. Instead, at least for now, I have to stick with the sloppy grind downward in price similar to the 1975 corrective period.
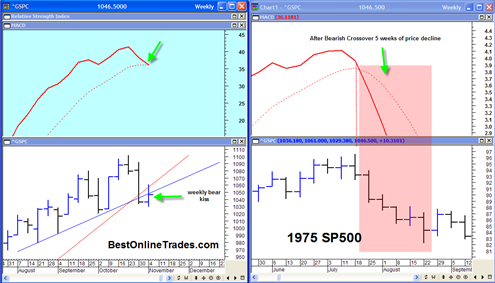
The chart above shows the updated WEEKLY price charts of the SP500 for the current period and the 1975 period. You can see that on the left side of the chart, the 2009 period we are just inches away from a confirmed bearish weekly MACD cross. I realize that the MACD can sometimes be somewhat of a lagging indicator, however once a negative crossover occurs there is usually at least some type of price weakness at best and at worst severe downside price action.
It is on the verge of crossing and the opening weekly price on Monday November 9th should move the solid signal line deep under the dotted moving average line. I say ‘it should’. It will as long as price does not rally 100 to 150 S&P points higher early next week. Rallying 100 to 150 S&P points is certainly possible, it is also highly unlikely from all the signals I am seeing now.
Note also on the 2009 portion of the S&P 500 that the red solid line is the support line that was recently broken with high volume and now price on a WEEKLY basis has rallied back up to KISS this red trendline. The red trendline now acts as resistance and we can see the weekly SP500 has bumped its head on it.
That is ominous and implies that next week will be down hard.
The right portion of the chart is the 1975 period. Note where the weekly MACD had its downside crossover and note afterwards we saw 5 FULL weeks of fairly persistent downward price action.
So everything is lining up for next week to be quite a bad down week. The hard part is determining if it will be a deflationary crash type price action with a one day –5% to –10% down day, OR something more orderly. No way I can predict that, all I can say is with a reasonable degree of confidence is that we are hard down next week.
Note also that we have the big currency meeting this Friday and Saturday and we have this astro COMBUST (combustion) date that falls either on this Friday or Monday the 9th. Monday the 9th is a bradley model date.
So those important dates are likely either going to be acceleration dates that really kick start the decline in high gear, OR they may serve as selling climax dates. That is my take anyway. The part that does not make sense is the selling climax date since we are only talking the next 3 trading days. For them to be selling climax dates, it would suggest we get very severe panic type move down into those dates.
But based on the chart structure and the fact that we are just now doing a bearish weekly crossover, I have to conclude that they will serve as acceleration dates that kick start this decline into high gear.
We will just have to wait and see!

