
The sp500 today once again briefly pierced the lower Bollinger Band and the Bollinger bands themselves have continued to expand wider. This is an indication that we are entering early stages of a volatility expansion which is in contrast to the volatility contraction that occurred during the last several months. The movement higher in the VIX volatility index today is confirming this fact as it broke out today from its large falling wedge formation.
I really have not used Bollinger Bands that much in my analysis but I might start to use them a lot more because they can be a very useful tool for trend direction signals. They are most useful to me when I see the Bollinger bands move from a state of low volatility (a contraction) to expanding volatility. The expansion of the bands often signals the start of a new more volatile move. The piercing of price under either the higher or lower band can be an indication that price now wants to trend or hug closely that particular Bollinger band line.

Sometimes price moves so fast that it can trade almost completely outside one of the lower or upper Bollinger Bands. This is very rare and is usually a point where the market has climaxed and ready to trade sideways again.
So I will say that the next 3 to 4 trading days are going to be very interesting. Even if we do get a bounce higher, I suspect that it will only be a one day bounce and we will see a quick resumption of prices back down to the lower Bollinger band that hugs the lower band again.
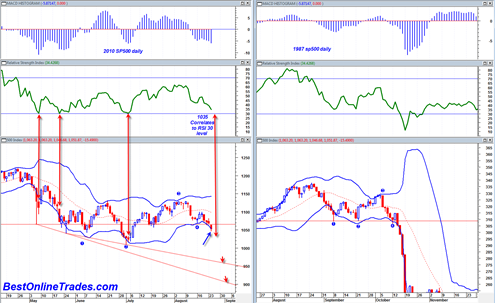
The RSI hit a value of 34.42 today and continues to move lower. I think the 30 RSI level is going to be potentially very important. As you can see from the chart above the market has bounced strongly and made short term bottoms already 3 times from the 30 RSI (relative strength index) level. A value of 1035 in the sp500 correlates to the 30 RSI level if we are to get there tomorrow.
So the most important question in my mind at this point is… Do we get a sustainable bounce from the 1035 sp500 level onward? I will be watching 1035 and the RSI level very closely in the days ahead. It is possible that we only get a 1 day bounce higher upon hitting that level.
The real key for more severe price destruction will be a move of the RSI below the 30 level in the days ahead. Below 30 is the power zone for the bears. If the sp500 manages to trade down low enough to get the RSI below 30 then I would expect to see very fast price destruction that leads to a climax.
Indeed, the high volume doji that we printed today looks quite similar to the 5/5/2010 high volume doji that was printed on the SPY ETF. Whether or not it leads to another flash crash soon remains to be seen. But again, the key for me is whether 30 RSI leads to supportive bounce of some kind.
In the left hand portion of the chart above you can see two dotted red channel lines that show 950 and 900 as supporting ranges on the sp500. One of these levels could very well be the low point for the coming price decline.
So there are plenty of dynamics at work right now. The RSI, the Bollinger Bands, and the bottom supporting channel lines. I think all of these combined are going to help show the way in the days ahead.
Only a move to a 11 value on the RSI would be the equivalent of an 1987 style crash. We may know as soon as early next week whether that is achievable or not. But I think at this point the 950 target on the sp500 is the most reasonable target based on the channel lines. Anything below that level would equate to a busting of the channel and a truly ultra bearish scenario. . .