
The Sp500 continues to currently trade within an inverted triangle or a broadening wedge formation. This type of pattern has been very common in recent years and you are likely to see many more or them on many different markets. They paint a picture of indecision and confusion and can be very difficult identify early in their formation and are clearly frustrating for both bulls and bears.
To be honest I hate this pattern because it is so confusing. Credit for the identification of this pattern goes to a comment poster here named Shrihas. Shrihas pointed out this pattern to me on 7/1/2010 and 7/2/2010 and at the time I was extremely bearish and because of my excessive bearishness I recognized the point he was making but to be honest I did not want to believe it because of my bias.
The action of 7/6/2010 and 7/7/2010 however completely turned me around into a bullish stance because of the new bullish divergence being created along with the inverted triangle.
The mentioned in a previous post that we would likely need to see the market stage a rapid advance in order to overcome the downward forces of the bearish 50/200 moving average bearish cross. Relative to the action of the previous two months, price needs to get in a situation (on a closing basis) where it moves higher at a pretty good rate to help rapidly shift the moving averages around topside again. It does not mean that we have to trade upwards in a straight line but the sooner we can reach higher levels (above the 50 day and 200 day moving average) the better.
I suspect that August will be the month that contains a good portion of the retracement of the recent rally. That would actually work out well in terms of the bullish scenario since August is likely to be a low volume month.

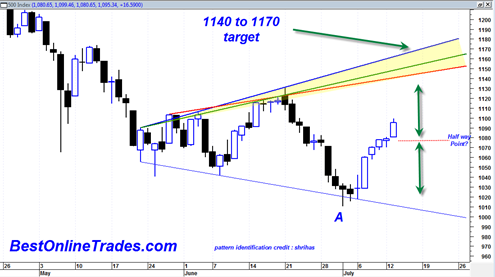
The chart shows that this rally could find a stopping point between 1140 and 1180 (the top of the broadening wedge –inverted triangle) depending on which line you prefer (blue green or red). The red line is the most conservative stopping point.
From there the market is likely to start a retracement leg.
The doji we say yesterday in the market could be a half way point of this recent move and would fit in nicely with a move to 1140. The 6/21/2010 swing high is also an important market testing point. That value is 1131.23. There will probably be some sort of doji or reversal day at that level as it represents an important level where many got trapped. It will also be useful to see what kind of volume that swing high is tested with.
If there is one lesson from the chart above it is simply that channel lines are very important to pay attention to these days because the markets have this tendency to trade in these weird patterns. On June 7, 2010 I suppose one could have constructed the bottom portion of this inverted triangle and maybe also the top portion as well. It would have been early but it would have been a very useful tool in determining upcoming extreme points and reversal levels.
By the way my weekly charts of the sp500 are showing confirmed weekly trend changes based on the weekly MACD historgram. Of course this week is not fully over yet but if we close higher than where we did today then this still be a weekly confirmed trend change to the up direction.
Hi,
Are you saying we are at a point where we could swing back to the 1040 and then back up into a bull left upto 1140-1170 since we are at the halfway point or are you implying that albeit not straight up , we will first test 1140-1170 before turning a leg lower ?
About your bearish to bullish stance, I am seriously wondering if OPEX week has something to do with the way this week has played out. typically, July opex is historically bullish with a bearish OE friday (this time it rests on the banks and china GDP thursday amongst the plethora of other data coming out). Earnings have been strong in the wake of lowered estimates over the last 2 weeks (as the market trended lower) so yea earnings may be good and sure Intel blew it out of the park but something just doesnt seem right . In my opinion , I think we will test 1108-1115 by end of close tomorrow but I think people will start to take profits on Friday after Google’s earnings (I expect them to be great but predict that the stock is going to sell on the news at least 3 % given the recent 14% run up in the last 5 days alone. Monday seems like Aapl’s earnings will also be a sell on the news and I expect a slightly lower GDP number from China on Thursday.
Anyways, we will see and I hope you will be able to answer my questions. I am a pretty new trader / investor and your blog has been very englightening for me thus far.
Thanks for the hard work .
Regards,
Ayush
AK,
I was referring to half way point because of that candlestick formation called a doji. Sometimes doji’s can be a resting point and half way point for the rest of the move. It is somewhat of a guess though and should not replace other indicators.
I really do not know if we will test 1040 before reaching the topside resistance. It seems unlikely now given the market’s current upwards momentum and still feeding off of the positive divergence. Certainly a pullback of some sort will be necessary but I would not be surprised if it does not come in until we press up a little bit higher, perhaps on Friday this week as you indicate.
I think you are right about people taking profits this Friday. Seems to fit a pattern of some lingering bearishness into a weekend.
As far as earnings, I am sure there will be wild swings in both directions. Very tough to predict the reactions to the numbers or to any fundamental data. We are getting good earnings reports now, but I am sure there will be a few bombs and maybe that is what will get the market to turn.
Regardless I am seeing confirmed turns on weekly indicators. As long as we do not fall apart totally this week, we should be getting a nice setup going forward.