
I think it is fair to say that today is the kind of day that accomplished nothing more than creating doubt for both the bulls and the bears. Not much was lost today, but not much was gained either.
On the other hand, those that are biased more towards the long side might say that today continues to support the northward case given that we did not lose any ground today and simply consolidated. I tend to agree with that view for now. But the bearish side would probably point out the absolutely horrible volume today which is a valid point.
On the sp500 we printed a small doji candlestick which could simply be a pause in the uptrend or a possible short term reversal signal. If we close below it tomorrow then maybe the reversal signal would get traction. If we close above it tomorrow then it will have shown itself to have been a simple pause in the up trend.
The McClellan summation index ticked higher again today and still seems to be in northward trending mode. The summation index does seem to be suggesting that a test of the April 2010 highs is at hand within the next 1 to 2 weeks.
I can tell you also today that I had an ‘a ha’ moment today. What is an ‘a ha’ moment ? It is one of those realizations you get where a previous confusion or complexity turns into a newly enlightened mindset.
The ‘a ha’ moment I had has to do with the monthly MACD on the DJIA. I realized that during the months of April 2010 to July 2010 (basically the large trading range correction) I was in quite a bearish mindset. It got the point where I was even anticipating some type of market crash and doing pattern analysis with the 1987 period.
But what I realized yesterday was that during this ENTIRE large swing trading range the MONTHLY MACD on the sp500, DJIA and other major indices was still in a bullish stance. A disciplined trading approach would have been to assume that the correction that started in April 2010 was really only likely to be a pause in the uptrend as long as the monthly MACD remained in a bullish stance.
This is exactly what happened. The monthly MACD DID remain in a bullish stance throughout the entire April to August correction. We also saw the market stop and turn at the 38.2 % fibo retracement level as well (from the March 2009 lows). So with 20/20 hindsight the most appropriate approach was to presume that the correction that began in April 2010 was only likely going to be a consolidation of the uptrend UNLESS we could somehow get a bearish MONTHLY MACD downside cross.
In order for really strong ‘ease of movement to the downside’ bearish tape action to occur, one must have the MONTHLY MACD in a full bearish stance, and preferably under the zero midpoint line.
The second insight has to do with Stan Weinstein’s indication of a ‘continuation buy signal’. A continuation buy signal occurs only after a stock or market has already advanced and consolidated back towards its 30 week moving average.
First comes the stage 1 based which was in 2008 to 2009 time frame. Then comes the stage 2 advance which was from March 2009 to April 2010. Then after the stage two advance as long as the market or stock does not bust severely below the 30 week moving average and start to turn the 30 week moving average DOWN, then one can get a continuation buy signal for a follow on advance.
This is how the setup is right now in the major indices. The 30 week moving average is trading flat and is not with a downward slope. Price is moving higher off of this consolidation. So it would seem that a continuation buy signal is activated.
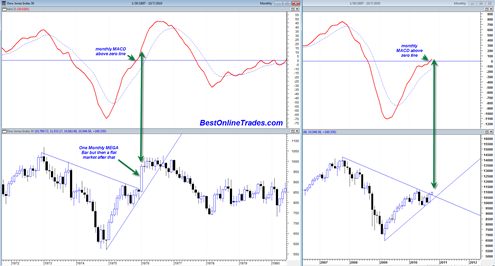
If you look closely at the chart below with the 1970’s on the left and the current time frame on the right you can see the striking parallel in terms of the price pattern and the monthly MACD. I indicated before that a monthly price close above the September 2010 monthly candle would activate a bullish monthly MACD histogram buy signal. October is not over yet, but it is looking that the monthly buy signal may come in.

After the consolidation was over in 1975 and the market managed to break topside from the consolidation and down trend resistance we also can see that the monthly MACD turned strongly north above the zero line. This led to an absolutely HUGE northward large upside candlestick. I can only assume that this large northward candlestick was a final massive short covering type rally.
Whether or not we get another one of those in the current time frame remains to be seen. But it is also key to note that after this large blast higher in 1975, the market then basically traded sideways for 1 full year and then declined for the year after that. The bearish decline portion was correctly signaled by the monthly bearish MACD crossover.
Currently we are nowhere near a bearish monthly crossover. However I can assure you that when and if we eventually do get to that point I will start talking about it.
It is really hard to make a bearish case when the Dow Industrials, the Dow Utilities and the Dow Transportations are all showing golden crosses along with the McClellan Oscillator confirming upside pressure.
The course of least resistance sure seems to be up, up and away.
Still, oh well who knows!
the chart you included tonight sure looks like the charts you were promoting during July when you were going on about the possibility of a crash and the cardinal complex / astro. the only difference is that the 1987 and the April 10 charts were daily charts and the chart u have tonight is monthly chart.
The golden crosses or death crosses doesn’t mean jack when helicopter Ben is involved. Look at the Dow on July 6 when the death cross happened, the Dow had gain over 1000 point from July 6 to August 9. This is not a free market anymore, helicopter Ben can make the chart look however he wants. Sure TA does help but it can be manipulated accordingly by the force who has the most $$$.
The monthly chart does have a slight resemblance to the 87 setup but this time on the monthly scale. That is a good point. And the rally is on light volume. But then the 2007 trendline break and other factors seem to invalidate an 87 repeat on monthly scale. The only thing that would get me thinking about 87 again is if we see a 3 to 5% down day in October.
Death crosses and golden crosses can be confusing. I guess they are better interpreted within the overall context of market action and market cycle. Maybe they are overrated sometimes.
JR yes I tend to agree with you… up up and away for now.
Hey Rice:
You are right but if you note the trans were not confirming a death cross at that point.
Dow theory calls for all three to be in tandem, one confirming the other.
To find all three forming golden crosses is one of several technical indicators that show a bullish direction.
But of course you are right, technicals cannot overcome strong government interference, at least in the short run.
But it seems to me Big Ben is also supporting a rise in the market.
But as I said who can tell, for example random events can upset any apple cart. For example another 9-11!
We live in uncertain time and although the future we cannot see we guess and fear!
Although fascinating to follow, in the end, trying to use a random, one of a kind price movement from the past like the pattern that preceded the 1987 crash is rather futile. What makes us think that one unique random pattern is going to be the model and repeat itself for any other later price action
It’s kind of like a belief in an evolution where life began in some accidental, random chemical reaction in some slime pool millions of years ago. So what “intelligence” is in this
“organism” that would cause it to want to reproduce itself, let alone evolve in to a higher form of life?