
The sp500 today traded reluctantly down after hitting its ‘head’ on the top long term bear market resistance trend line. Today’s price action was at first in the form of a small narrow range doji. It was also initially completely within the range of last Friday’s price candlestick. So the setup at the beginning of the day was a ‘double inside day’ which can sometimes lead to big moves.
We got a down move and closed modestly down in terms of price and volume. Volume on the SPY was unusually weak and is a bit of a concerning sign as far as the bear case is concerned.
I really want to see a confirmed sign of weakness in price and volume that leaves zero doubt that the uptrend since early September is broken. It is actually already broken if a trend line is drawn from the 1st of September up to recent highs, but it is not really broken with conviction yet.
The closing ARMS reading today at least on a 1 day basis was nothing unusual or extreme and maybe shows that there is almost zero fear in the market right now.
The Volatility Index continues to be squeezed slightly above a large falling wedge pattern. It would seem that the VIX is about to launch higher in a big way, but it is still trying to get some running legs. Sometimes northward moves out of falling wedges can very fast and abrupt right back to the top of the wedge. This would seem to suggest that a sharp and abrupt move DOWN is within sight on the sp500.
The McClellan summation index on the NYSE ticked down today and may be starting to finally roll over. It looks a bit like the summation index has double topped.
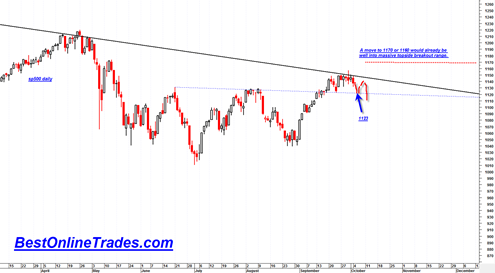
I am ‘looking for’ a move down to 1123 on the sp500 at which point I would expect some type of northward bounce to occur for 1 or two days. Then after that I expect another drop that breaks below 1123.
The sp500 really needs to break under 1123 to kick start much greater bearish momentum. If we are still going sideways and above 1123 by Thursday then I am going to start to get quite nervous about the topside bullish breakout possibility. The problem with going sideways too long is that it can move indicators into oversold range without any loss of price.
But I think we have a good shot at 1123 soon. The market is bumping its head on the top long term 2007 bear market resistance channel line. We are moving sideways in what I consider to be distribution. There is no fear up here at these heights. Some are still looking for another upward thrust to 1160 or 1170 before turning lower but if we get to 1170 then it would put the market well above the long term 2007 bear market resistance line and put us in clear breakout territory. I have a hard time seeing that occur only a few days into October monthly candlestick.

The US Dollar Index and the UUP ETF got a bid today and started to bounce higher off of the indicated oversold level and support area I indicated this past weekend. So it would seem if the US Dollar Index can get more of a spike bounce higher, it would start to chip away at the sp500 bulls. This is what I am expecting.
Assuming we do start to build more price momentum downwards, it will be important to see what kind of downside volume comes in. I am going to be tracking the average downside volume run rate on the SPY ETF if the decline trend starts to take shape. If it does not come in heavier than the previous two topside rally legs, it will start to create doubt about its ultimate depth. On the other hand, a volume run rate similar to the end of April to Mid May 2010 time period would put a good dose of confidence in this being a new strong bear trend.