
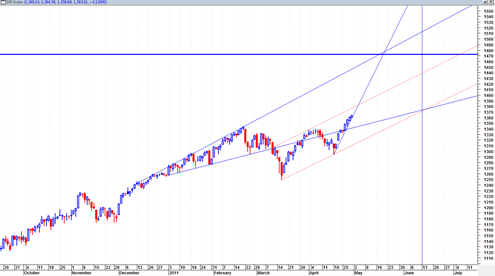
The sp500 continues to push higher on a rather steep up trendline. However it does appear to be close to the top of a new channel formation. If the channel is valid then we could start to see some price give back and a more modified up trend.
If the channel is incorrect then we could see the market continue in some type of parabolic type move.
The relative strength index is near the power zone ( on the daily chart ) and seems to support such a parabolic type move.
Still, the power of the near term channel cannot be denied. We will have to see how the market reacts to the channel (or not).
The channel is drawn in with red dotted lines. The red dotted price channel is also within the very large broadening wedge structure. I still view it as a possibility that the market could trade back up to the topside of the large broadening wedge structure.

Seasonally the month of August is the beginning of the ‘worry’ phase before a usually very bad September or October. So that would seem to leave 3 solid months of possible constructive upside, assuming the mid June 2011 date fails as a turning point. But the mid June 2011 date is still a potential trend changer in my mind. The problem is, it is only about 30 trading days away which does not leave the market much time to make enough of a huge move…or does it ?