
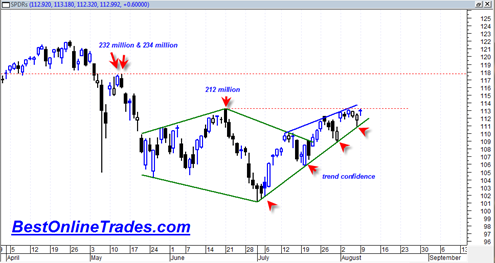
The SPDR S&P 500 ETF has still not after 6 full trading days managed to break above or test the 113.20 swing high which was on 212 million shares back on 6/21/2010. Today the volume on the SPDR S&P 500 ETF was only 118 million shares.
We basically have traded sideways in a rectangle formation for the last 6 trading days right under the critical 113.20 swing high.
Here are the bullish and bearish points for the SPY:
Bullish:
- Price during the last 6 trading days has not given much back and instead only moved sideways. This is 6 days of sideways cause on low volume. It is potentially bullish in the sense that the 6/21/2010 swing has not been tested and may get tested tomorrow on a sign of strength. It would have been much more bearish setup if we had tested the 6/21/2010 swing on one of these recent very low volume days of 112 million shares and then closed under the 6/21/2010 swing high. INSTEAD, we are hunching right UNDER the 6/21/2010 level and have now built 6 days of sideways cause. I suspect the bulls want to pop this market over the 113.20 tomorrow.
- If the bulls CLOSE the SPY above the 113.20 tomorrow then it can still allow for more room to the upside even if the volume is very light as it has been recently.
- The bulls now have 4 full touches on the green rising up trendline since July 1st, 2010.
- WEEKLY MACD is just mere inches away from a bullish crossover.
- The 50 day moving average has curled up and if we start to move quickly higher in the next 5 to 10 trading days it will start to position the 50 day moving average into a stance for an upside cross of the 200 day moving average negating the previous bear signal.
Bearish:
- If the market moves above the 113.20 swing high tomorrow and then closes under the 113.20 AND also shows very light volume (maybe 150 million or less), then that would be a valid sell signal and the market has shown us it wants to trade back to the other side of the range which is down from here or near the bottom of the rising wedge formation near 112.
- If somehow the SPY can break well under 112 tomorrow it would be a break down from the green up trendline and a break down from the rising wedge. This scenario now looks very unlikely to me but I am open to being surprised. Surprises can and do happen in a low volume type month like August.
- The bears really have their work cut out for them. They are going to have to bring in all the kings horses and all the kings men to try to defend the 113.20 level on the SPY. I am afraid they are not going to succeed. It does not look good for them right now.
- If I had to name just one thing in favor of the bears it would be that many times in the past mid to late August is an ideal time for massive corrections to begin into the October period. So if the bulls do manage to take us higher we may get to the next critical 118 level as a possible bearish topping level for some type of correction again.
It would seem that some very big volatility is about to come into the market during the next 3 trading days. The key levels are very clear and the patterns and structure of the market will guide the way…

The next three trading days are supposed to be extremely negative cycle and Astro dates. But if you look at the chart of the SPY it would seem as though the market could care less about any astro effects at this point. Unless the market is moving up into these dates as a high.
I think at this point I can almost stick a fork in all the astro dates I was talking about before. They have not delivered anything substantial. In fact them seem to have inverted. Whether or not they invert during the next three days remains to be seen. But the weekly trend is now poised to move us up.
It will be very interesting to see how the market closes tomorrow, perhaps there will be a surprise in the tape action.