
The weekly chart of the spot gold price shows that gold setting up for a very important test next week. The test is to see whether or not the gold price can hold longer term uptrendline support on the weekly chart.
The uptrend shown in the first chart below is a 2 year uptrend line and has a good degree of significance. If we break down through this trendline on the weekly chart next week then one has to question the current integrity of the gold bull market in my opinion.
I did a couple other recent posts pointing out the weekly bearish divergence on the gold price chart and the similarity to the mid 1970s gold price topping formation.
If gold breaks down through the uptrendline next week then it would probably challenge the 1160 level which is an important level of support as it was the neckline level of the previous inverse head and shoulder bottom formation (see it drawn in on the first chart below).
If 1160 breaks then it could imply an eventual test of 990 level which once again is a very important level of support and again the neckline level of the previous massive inverse head and shoulder bottom formation.
Perhaps I am looking much too far ahead, but if we do get to 990 and then 990 also breaks it could imply a move down to 680 as a possible final bottom. That would be roughly a 46% drop from the spot gold all time highs.

I think it is important to keep in mind that the gold price has been going up since 2001 or almost 10 years. I am probably repeating this line of thought from a previous post, but even very strong bull market uptrends sometimes need a mid point correction as a pivot point for the eventual blow off down the road.
Gold in the 1970s
This is exactly what happened during the mid 1970’s in the gold price.
Gold went from 35 to 200 into 1975 or 471%. But then it went into a 50% correction down to 100. That eventual 100 dollar level in gold was the pivot point for the eventual massive blow off run to 850 gold price or a move of 750%.
At the time the gold price hit 100 there were likely mining stocks at that time available for literally pennies on the dollar.
If we do go into an eventual 50% drop in the gold price it would likely slam down the mining stocks very badly because the mining stocks have such high betas relative to the gold price on the upside and on the downside. So a 50% drop in the gold price could mean 90 to 95% drops in certain mining stocks.
If we calculate the percentage move in the gold price since 2001 we see that it has gone from 253 to 1265 or a 400% move so far. This move is similar to the 471% move in the early 70’s but shy of it by about 70%. A price of 1450 gold would make the gain from 253 about 470%.
Of course the comparison periods do not have to be exactly the same. It would be absurd to think that they should be. It is a rough comparison the past bull run to the current one.
Gold Price at 5780 ?!
So assuming we do break down to 680 eventually, then also continue from that point into the eventual massive blow off run of 750% it would lead to an eventual target of 5,780 dollar gold price.
So when the gold bulls talk about us zooming to 2000, 3000, 4000 and 5000 dollars gold price, they may be forgetting to consider the important point that even long term bull markets need large corrective pivot points as catapult point for the eventual blow off.
It seems easy to forget sometimes that gold is actually a commodity and trades like a commodity. Lately it just seems like it is trading like proctor and gamble with low volatility. But gold still is a commodity and you just have to look at a long term price chart of the CRB commodity research bureau commodity index chart to see how volatile commodities can be.
It is going to be interesting to see how this plays out. If it does evolve into a multi year bear market then I will be watching the monthly MACD looking for it to transition back down to the zero midpoint line where an eventual massive buy signal would probably be triggered again. Stay tuned to BestOnlineTrades because if this plays out similar to what I write in this post then that buy signal near the zero line will probably be the greatest buy of a lifetime.
The monthly MACD is starting to curl over into a sell signal but is not near confirmation yet. It takes a long time to move the monthly indicators for obvious reasons.
Gold Parabola holds the Key
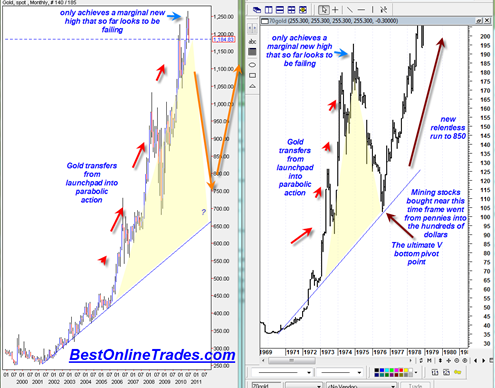
Lastly, take a look at this comparison chart of the 70s gold bull run compared to the current bull run. You can see that the personality of the gold price is to trade into high arcing parabolas after an initial launching plane. This parabola price action is of course very nice when the trend is up, but when it decides to correct it can be severe in the opposite direction.
The run from 100 to 850 was much more persistent and powerful than the run from 35 to 200. I would expect a similar situation to be true from a move from 680 to 5800.

Multi millionaires and billionaires are going to be made from the gold bull market. But for those long since 2001 how many would still hold on tight with strong hands if gold goes to 650 ? Keeping an eye on the psychology is going to be very important as the longer term trend transfers from bullish to bearish.
But before anything can transfer, we first need to break the up trendline support as indicated in the first chart and in my beginning commentary.
Tom
Sorry, but I think you post is total rubbish. Your “call” is identical to that of a commentator on Kitco. He has been calling for gold crash to $640 for the past year and his “fractal” pattern calls for the bottom in October 2010! He has been soooo wrong it has been ludicrous. Along with a crash in gold he has been calling for a crash in the market.
His call is running out of time – – – quick.
I grant you that gold could pull back and break the uptrend line. I hope it does. I have held gold for about 6 years (2008 was very painful – but I held on). When the India Central Bank bought 200 tons of gold from IMF at US$1040 per ounce about 9 months ago, I think that put the floor on gold price for a very long time. I agree that gold looks very very long in the tooth, but I have seen this before AND GOLD STARTING IN MID AUGUST IS ENTERING ITS SEASONALLY VERY STRONG PERIOD – – mid Aug to mid Feb.
I hope gold falls and breaks some trendlines. I have lightened up over the past 4 months, but I expect the most likely outcome is for gold to confound the doubters and to surge upward without any meaningful pullback. In that case, I will have lost out.
If gold dives, I would be shocked if the overall market did not dive right along with it. The world economies are on precipice and can only be supported by printing money which will eventually lead to gold much much higher (from here)
Sorry to sound like a kook, but your posting really struck a nerve. I am sorry, but your posting is either complete utter rubbish or the posting is, like the posting of the commentator on Kitco, the call of the century – – or possibly longer.
I hope gold breaks down, but floor is $1040 or thereabouts and if it goes there, who cares, only a decline of 11% from here!
You are welcome to request that I stop posting comments. If you do, I will comply. It is obvious that you put a lot of research and time into your posts. Or if there is some way you can block my comments, I would understand.
THANKS YOUR COMMENTARY EVEN IF I SOME TIMES VIOLENTLY DISAGREE.
Hello Geoff,
I have to admit it is scary to make a call against gold because it has been so strong for so long and generally speaking it is a bad idea to look contrary to such a long and extremely strong trend.
Keep in mind that my commentary on gold is only based on what I am seeing in the indicators up to this point. I talked about the bearish weekly divergence versus the MACD. So far it looks like this could still play out. But we have seen gold in the past completely evade many bearish signals because it has been so strong. It may do so again this year, so we will have to wait and see.
Admittedly the other confusion comes when we look at the general stock market and the gold market together. I have to admit it is a little bit confusing to think that the stock market will not go much higher and that gold will go down for a couple years. This has not been the trend in the past at all.
I have seen that author on Kitco too and I have read some of his posts. I believe I had the same feeling a year or two ago when I read his articles. Not sure if he uses technical analysis or gut feelings.
But again, my opinions are just from what I see in the charts. I have been wrong before and I could be wrong about those comments I made about gold as well.
I do agree with you that September and August Time frame is a very important time frame for gold. If I am wrong then we may really start to see gold start to rocket higher during that time.
I see no reason to block your comments. You make some interesting points here and I welcome your commentary. There is always a bull side and a bear side to everything. It is the nature of the beast.
Ultimately the main goal here is to try to get the short term, intermediate term and long term direction correct for the mutual benefit of all. I would love to be adamantly bullish on gold and maybe I will be sometime in August if gold decides to invalidate the intermediate term bearish signals.