
Today was Fed decision day and it did not disappoint in terms of providing some volatility today.
My gut instinct today was that the market would do the typical thing today and sell off a bit on the 2pm announcement and then rally into the close and blast higher after that. I actually thought today the market would close up a few hundred points (on the DJIA). So we did not get the aforementioned rally. Instead we got a decent sell off and more notably the sell off was on significant volume. This is never a good sign near market highs.
Today was clearly a pivotal day and the market had the opportunity to turn today’s daily indicators and weekly indicators into a bullish stance. Instead, the daily indicators re affirm the more bearish short term stance. Still, there are 2 days left in the week before any final verdict. Right now there exists a bearish triple P on the daily MACD histogram which opens the door for a close under today’s low which would be a confirmed sell signal.
We will have to see how the week finished out, but right now it is not looking good for the bullish side.
Key today also was the US Dollar index which rallied strongly and the gold price took a huge hit to the downside. This is important because we may be at a very key long term reversal in the dollar (from down to up) which supports the longer term theory that the markets have made a major top in this zone (and that we are headed for deflation again ? ). While true that one day does not a trend make (in the US dollar), but today was a sign of strength in the US Dollar which seems to confirm a very large bullish gartley fibonacci pattern (in the UUP ETF) which has been in existence from May 2011 to present time frame. Large Fib reversal patterns show evidence of confirmation when we see strong price reactions near the end of the pattern reversal zones.
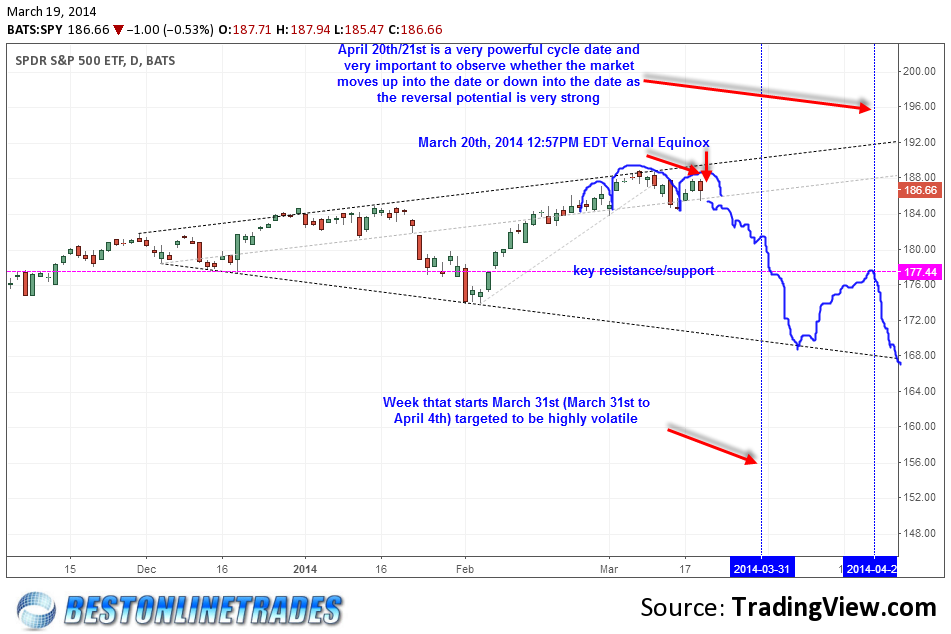
The chart of the SPY above shows that we still appear to be trading in a large broadening wedge type pattern. The recent price action over the last few weeks has been essentially ‘hugging’ the top portion boundary of the broadening wedge and appears to have formed a small head and shoulders top pattern. Today’s high volume break down could be a sign that the right shoulder of the pattern is near completion which could result in a high volatility break of the neckline to the downside and the initiation of a new leg down trend into April 7th 2014.
Notable on the chart is that on Thursday March 20th at 12:57PM Eastern Daylight Time is the Vernal Equinox. This is mentioned because it could serve as a reversal point from up to down in the context of the small head and shoulders topping pattern.
The next key notable aspect of the chart is the pink horizontal line that is likely to serve as key support and/or resistance. Assuming it is broken through to the downside with a lot of thrust, then we could see it turn into significant resistance for the market going forward.
The week that starts March 31st could be an epicenter zone for volatility and market mini panic. It is possible that some type of market low forms during this time frame. If this scenario is correct and it lands the SPY near 170, then a further scenario is for a bounce to occur from that zone possible into the very key cycle date of April 20th/21st. This scenario is highly speculative right now. The clarity of the potential scenario should become more clear as we move into March 31st/April 7th 2014.
I will say that the potential scenario shown in the chart above is the most bearish potential scenario because it allows the market to bottom before the April 21st date, and then runs UP INTO the April 21st date.
A more lasting market bottom scenario would involved the market taking plenty of time to just roll into the April 21st date as a major intermediate term low.
In the near term, the first sign that this scenario could possible engage is a move on a closing basis of the SPY BELOW 184.44.