
The SPDR S&P 500 ETF today accomplished a bullish spring of the May 6, 2010 mini crash swing low during the last 2 hours of trading today. A bullish spring is when volume is not sufficiently heavy enough relative to previous swings and closing price is above those previous swings.
It was a close call today because the way the market was set up (including macd histogram, RSI and some other indicators) it really needed to get a good reversal going again otherwise it would have put the market at risk of a very severe plunge below May 6, 2010 support. It just goes to show how the market is capable of putting everything on the line with only a few hours left to finally give the reversal signal. The action today had the flavor of capitulation and leaves me much more confident that a true reversal is at hand. How high the bounce is remains an open question however.
Also helping the bounce case is the US Dollar Index. It looks like it double topped today on the daily chart and should get some type of move back down to its own 50 day moving average. Perhaps that will support equities for the next 5 to 10 trading days.
I am going to try not to make the mistake of shorting this bounce too early. I want to give the market plenty of room to do its thing.

The SPY chart shows that we have a huge reversal candle that engulfed the previous days bearish candle body. On the actual sp500 index chart I see a long tail reversal hammer which is another powerful reversal signal.
You can clearly see the bullish divergence that exists between price and MACD histogram (yellow bars). The current bullish divergence looks similar to the one that existed in the January 2010 time frame.
The volume comparison between the previous two significant price swings shows the the market today did not have enough force or energy to break through to the downside. The volume was 20 to 38% less on today’s price swing and that is a valid bullish spring reversal signal.
 So combined with the macd histogram, the reversal candles, and the US Dollar Index topping BestOnlineTrades officially gives this reversal an official stamp of approval.
The next challenge is identifying the next major topping point for a massive re shorting campaign, because I believe after this bounce (1 to 3 weeks ?) the market will have a decline even more ferocious than what we just experienced.
P.S. By the way I find it really interesting that we are hearing some war talk between North and South Korea. If you remember several posts ago I was talking about how on the previous Jupiter Saturn Opposition in July 1990 Iraq Invaded Kuwait and we went to war and that the May 23, 2010 opposition could be a very significant date. And just two days ago, on May 23, 20 years later we have another Jupiter Saturn Opposition and it seems as though the war drums are beating again between North and South Korea.
I am just astounded at how these astro aspects can nail world events like this. It is extremely fascinating to me but I admit I have no understanding of how or why it actually works.
Whether or not the situation over there develops into full scale war remains to be seen. But I can tell you with ZERO DOUBT that if the situation over there turns into full scale war and the USA is drawn into it as an ally (and perhaps China, Japan as well?) then you will see world markets drop like a rock, perhaps almost literally.
We have been over 10 years into our bear market so far (started year 2000) and usually you tend to see really negative type geopolitical events happen in the later stages of bear markets.
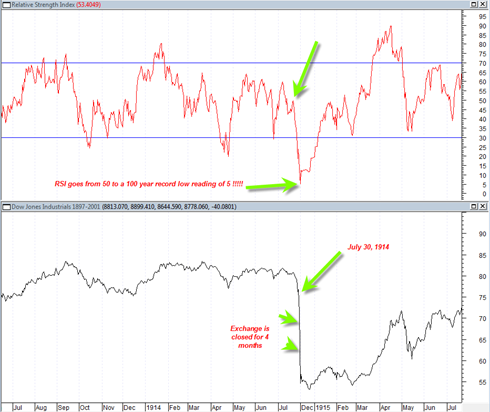
At the start of the 1910s, the decade would begin with the Panic of 1910–1911 stifling economic growth for a lengthy period of time. History would later take its course on July 30, 1914; as the average stood at a level of 71.42 when a decision was made to close down the New York Stock Exchange, and suspend trading for a span of 4 1/2 months. Some historians believe the exchange closed because of a concern that markets would plunge as a result of panic over the onset of World War I. An alternative explanation is that the Secretary of the Treasury,William Gibbs McAdoo, closed the exchange because he wanted to conserve the U.S. gold stock in order to launch the Federal Reserve System later that year, with enough gold to keep the U.S. at par with the gold standard. When the markets reopened on December 12, 1914, the index closed at 54, a drop of 24.39%
War is the last thing this market needs. The market is already fragile. Technically it is set up for a nice bounce now, but a bounce into June would set it up for a very ominous plunge in the July August time frames which are extremely astro negative.
Referring to the quote above, take a look at the DJIA for the time frame July 30, 1914:

Note the almost unbelievable fact that the RSI went from a reading of 50 to an all time record low reading of 5 when the exchange was re opened 4 months later !
Note also that the market literally went into a vertical drop so persistent that it defies all logic and left no chance for dip buyers or re shorting opportunities. Also interesting is that this decline occurred in JULY (not the typical month we would expect such a plunge, ie. usually it is September or October). It says to me that the market can see a 20 to 30% plunge in JULY. And guess what? July 2010 is only a month away.
All I can do is speculate here. I don’t know whether we can get another such persistent move as occurred in the 1914 time frame. But my main point here is that we saw an RSI reading of 5 there. And it is an important reflection of previous market history and that it can happen.
If our current market moved to an RSI reading of 25 or 20 I am sure that many technicians would be looking to buy (including myself) based on it being extremely oversold. But the market can still move hundreds of points lower even with an RSI 25 or 20 reading. I am going to go on record and say that I believe at some point between now and September 2010 we will again see an RSI reading between 10 to 15 on the Sp500.
World War III, a European Debt Meltdown and some negative astro aspects may change the rules of the game for certain periods of time in this upcoming bear trend. Just something to think about.
Be open to possibilities that may previously have seemed unthinkable. Markets tend to act within normal ranges for long periods of time, but in vicious long term bear markets the rules can change for certain periods of time. I think part of the reason for that is a simple drying up of liquidity and fewer and fewer participants in the market which creates huge air pockets in the market.
Lets say we do break out into a serious war as a result of a NK SK situation along with allies of SK. And then in August after withdrawing 80 to 90% of troops from Iraq, things start to heat up there again as well. And then maybe throw in some Israel Iran tension or conflict.
That is going to be a lot for the market to digest. And it makes you wonder if we would actually close the exchange here again. I doubt that but we have already seen all this talk about stopping trading after 10% moves on individual stocks and we already have the circuit breaker rules for the indices. So who knows if they would be crazy enough to close the exchange again.
Ok, enough bearish talk.
For now the most important challenge is figuring out where this coming bounce will leads to… and for what period of time it will maintain the bounce!