
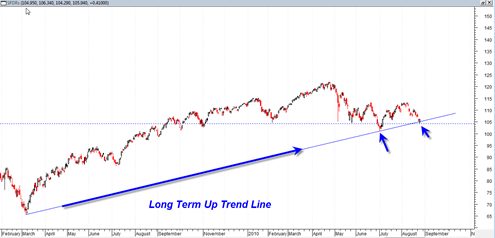
Yesterday we touched a very important long term up trend line. The up trend line that has been in force since the March 6, 2009 low. This long term up trend line has now been touched 3 times including yesterday.
The line represents the bullish trend. Despite all the sideways price action over the last several months the fact remains that we are still trading above this key longer term up trend line.
I usually like to see a strong reaction up from a trend line to show that there is real demand in the market. We already had a strong bounce up off of this trend line after July 1st, 2010. Whether we get another one during the next week or two remains to be seen.

A pretty simple chart but important to watch closely because if the bears are not able to bust below this up trend line with conviction during the next two weeks then it is going to significantly weaken the longer term bearish scenario. . .
Again as posted previously, no bullish conviction. Looks like they tested the 1060 resistance(previously support) probably confirming a iv wave top headed for a v bottom. Could possibly indicate a flash crash!
Absolutely no bullish conviction by me either. Absolutely NONE.
I’m bearish like hell as well. 950 on S&P in the cards now.