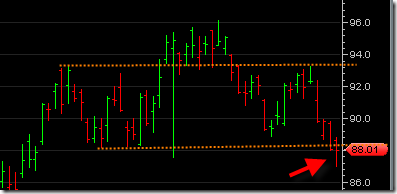
It is pretty clear at this point that the SPY ETF has pierced support which is also the lower end of the trading range we have been in since May.
I mentioned a couple of days ago that we had a bullish spring in the SPY ETF based on volume. Well as it turns out that bullish spring failed. The decline in volume was only 7.5% compared to the previous swing. Normally for the best signals you want to see greater than 10% less volume on a swing test. Also, the best way to try to play a bullish spring is go long and place a protective stop right under the low of that day.
Anyway, despite the decline the last few days the volume has not been too convincing (relative to the advancing volume that was occurring during the rally previous to May), but that could also be interpreted as complacency. The bottom line as we look at this trading range is that we have broken support and unless we jump right back inside this trading range quickly, we can only assume more down to come.
But how much down?
Well if we use Fibonacci retracements from the March low to the recent high in June we get 3 separate numbers on the SPY ETF that correspond to a .382, .50 and .618 retracement of the entire rally. So the numbers I have are 85.25, 81.76 and 78.27 respectively. A 50% retracement in a bull market is quite normal. So that would put us in the 81 range. We will just have to see how deep this correction goes.
I suspect that in the current environment you will see a lot more rallies fail on individual stocks and see more false breakouts as well, so buyer beware. I say sit on the sidelines for now.. But for more aggressive moves there are always the inverse ETFS that move up on a declining market.
For example the FAZ chart looks pretty good for some upward momentum coming off of a saucer bottom. I think FAZ has some more upside now that we have a break of the channel support in the S&P500.
