
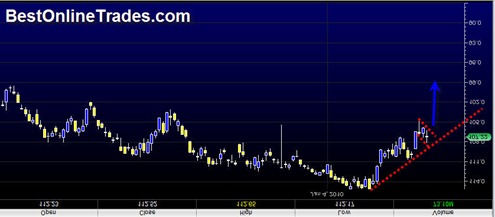

Believe it or not, the chart above is a chart of the SPY ETF. But instead of showing you the chart the normal way, I flipped the chart upside down and then mirrored the chart. So the price action you see at the right portion of the chart shows the SPY in a strong uptrend.
It shows a strong uptrend with trendline support and also a tight flag formation that appears to have room for another price bar within the flag formation tomorrow February 10th, 2010. But after that there should be a rapid resumption breakout upwards out of this flag formation that should lead prices significantly higher. I don’t believe this flag qualifies as a ‘high tight flag’ but it certainly looks like a tight flag, but not necessarily a ‘high’ one. The volume action is consistent with the formation of the flag.
But of course since this is the inverse chart, that would mean we should see prices break down by end of this week and/or into next week.
Price tends to move down much faster than it moves up because fear is such a strong emotion in the markets. So the funny thing is that when you look at the inverse chart as shown above the price advance looks unnaturally persistent. Normally price advances are more choppy and slow and climb a wall of fear.
So this is my take now on the SPY ETF and signals that new short positions between the end formation of the flag and the supporting uptrendline are ideal.
interesting perspective.
today was an up day stopping just shy of resistance on the DJIA. Maybe we will see pressure to the down side tomorrow. Starting a new channel maybe? As said before, there is no real reason to go to far down now, but if you work on wall st. you better not miss the ride up!