
Today’s market action sure felt like we either had a Fed decision or options expiration, but this was not the case at all. It was simply slow sloppy directionless Monday in late June trading.
I think the market today succeeded in keeping most bears and bulls completely clueless about what the next direction will be.
It has seemed as though in recent days that most if not all of the bearish bloggers I follow and other traders have turned neutral to long this market. Or they have closed out shorts and are waiting for 1150 or October 2010 before re shorting this market. My personal take is that neither of the above two will happen. My take is still that this market will collapse in the days and weeks ahead based on my indicators, chart pattern analysis and tape read of this market.
I can come up with plenty of reasons why this market could rally from here from a technical standpoint right now (at the bottom of a swing trading range, relatively low volume decline, oversold readings, full right shoulder not formed yet, poor seasonality for a new decline etc etc.) But I can also come up with a good bunch of reasons why the market could still collapse from here as well.
By the way it is nice to see that Bill McLaren on CNBC Friday sees very similar to what I see coming. He mentions about a move to 1040 and then a big one day bounce and then a total collapse after that. Actually I see instead a move down in the market the correlates with 14 day RSI (relative strength index) getting to 30, then a big one or two day bounce from there and then a total collapse. The most concerning aspect of this forecast is the fact that he actually came public with it on CNBC from a contrarian standpoint.
Astro Failure ?
I have to say that so far the Astro signals I have mentioned already many times seem to be useless at this point. Clearly today there was no volatility. I am not sure if I can say the Astro is a complete failure since sometimes the timing of them is slightly off and I suppose one could use the interpretation that the cardinal climax aspects that kick in today could be the starting point of the next move instead of a low point.
Enough of Astro for now.
The reasoning that it is unlikely for the market to drop big during this time of year (June July) is good reasoning. It is probably why a lot of former die hard bears are closing out shorts or going long right now.
On the other hand, the big drop that kicked off after April 1930 ended in late June and then went sideways July and August. So here we are at the end of June and the market still has not broken support. There simply is not much more wiggle room. I suppose going sideways is always an option but I don’t believe that scenario for now. My charts are still saying that we are very close to initiation of a big drop from here.
One thing I have been doing as of late is making a point of looking at the charts of all 30 DJIA stocks. If you look at the charts of Walmart, General Electric, Microsoft, Home Depot and Cisco you can see that they all look very bearish. Breaking down out of supporting levels and breaking down on big volume. The support they just broke through is now HEAVY resistance.
My ‘gut feel’ tells me that the break down we are seeing in those stocks is the same way the break down is going to look in the DJIA and the sp500.
Descending Triangles
Both the DJIA and the sp500 have similar descending triangle patterns and I fully expect them to evolve similar to the above stocks just mentioned. The market right now still has a bearish trend ‘feel’ to it and also a feel of weak rallies and pot hole risks at any time.
But of course we are talking about an entire market of stocks not just that handful I just mentioned. Some of the DJIA stocks actually look quite strong, maybe 1/3 of them. The other 1/3 look somewhat neutral, and the last 1/3 look very weak. So every stock is at a different stage. So I suspect that the weakest will lead the market down and creep fear into the market and start a slow cascade decline into an eventual climax.
Instead of a vicious sharp 1987 style plunge, we very well could be dealing with a slow motion meltdown where each semi big drop is met with either sideways or very slight uptrend action. This type of action will have everyone asleep at the wheel while at the same time managing maximum wealth destruction! That is the type of action that could move the DJIA to 1000 before people finally bail out completely!
My take on the two dojis we printed today and last Friday is simply that they are a pause in the current down trend. A doji does not have to mean that it is a reversal signal. Until it is confirmed as a reversal signal, we have to assume that it is simply a pause in the previous trend which in this case was down.
The GLD the TLT and the UUP
The SPDR Gold Trust GLD broke down badly today and could be a sign that liquidity is about to dry up. Gold looks at risk of a bad deflationary drop from here. It has not completely fallen apart and is technically still in an uptrend so maybe the rest of this week will seal the deal on a confirmed direction.
The TLT iShares Lehman 20+ Year Treas.Bond looks like a very clean bullish chart and is showing a massive ascending triangle and is right in the epicenter of a large breakout as of today. I suspect that the TLT will blast higher in the days weeks ahead on the fear trade. That should be enough to plummet stocks badly.
The UUP PowerShares DB US Dollar Index Bullish has pulled back in recent weeks on low volume decline and has just recently in the last few days kissed its own 50 day moving average. The RSI has become oversold enough that I can easily see the UUP blasting higher again. This resting point on the 50 day moving average is a nice spot for the UUP to catapult higher.
So the above three markets are positioned in a stance right now that helps to give me a little extra confidence the stock market will resume down again soon.
July 4, 2010
The way the market is setup right now I am seeing some potential that we are going to start sliding cascading into the 3 day July 4, 2010 holiday weekend. Normally I would just expect slow directionless trading during this time period. But since we are in this negative period, I just have this weird feeling that the market is possibly telegraphing it wants to head down into that date. Or head down a little bit into that date and then continue down much faster right after that date. Could it be that some external event will be triggered symbolically (or purposely) on America’s birthday?

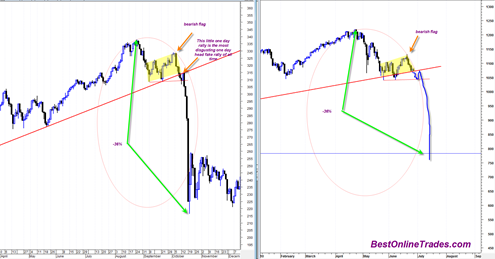
If you notice from the chart above the most recent two dojis we printed on the sp500 are not the most bullish looking type of reaction you want to see coming off of such an important long term uptrendline ( the solid red line). The poor upside reaction off of this line could be a clue that it will be penetrated to the downside now. I suppose there is till time to get a big reactionary upside bounce off of it, but it had better happen very soon. Also, we are now down to the red supporting trendline as a 3rd try. Many times you will see a market succeed on a breakthrough attempt on a third try. I don’t have any statistics to back that up, but I am just saying it from experience.
The yellow shaded areas represent flag patterns that have been supporting the market since the flash crash. They have a rising slope and so should be interpreted as bearish resolution type patterns.
The MOST bearish possible outcome I can think of in the days ahead is for the market to break down (either fast or slow) to the 1000 to 1040 area and then get a one or two day sharp rally right under the red trendline similar to what happened in 1987. A big rally from 1040 to 1070 would be about 2.8% and would put the market right under the red trendline just like happened in 1987.
By the way if you are wondering where the red uptrendline comes from it is simply the last remaining uptrendline that has defined the bullish uptrend since March 2009. It is connected by swing lows of Nov 2008, July 2009 and the current time frame May 2010.
In combination with this uptrendline we have many 50 day moving average 200 day moving average death cross configurations that are about to signal bearish crosses very soon, within 2 to 5 trading days on most indices. So regardless of what happens in the next week or so, the longer term trend momentum is still down.
Extremely well written analysis. Your analysis seems plausible, solid, and without pretense or pompousness.
Over the last week, I have slowly been adding to my puts while at the same time doing some harvesting of puts where the underlying stock has shown significant decline very recently. I have puts on restaurant stocks and QQQQ and hold long the TZA in both stock form and calls.
Again, thank you for your very thoughtful analysis which is a quite considerable effort. Thank you
Your welcome. Thank you for your comments. Let us see how it plays out. Amazing how the market is trying to trick everyone with its subtle moves lately…
I am still holding that short. DXD. This game is getting boring. Lets get on with it.