
Today was about as wild a day in the stock market as I can ever remember. I was not watching the market closely in 1987, but I certainly was watching it closely during October 2008.
I can tell you that the 2008 decline seemed much more orderly than today’s decline. The 2008 decline was smooth and steady but still persistent.
Today’s decline had much more flavor of panic, rapid price move, total confusion and despair. The talk on the mainstream networks that today’s decline was because of ‘error trades’ or other nonsense is completely ridiculous. Today’s decline occurred because the market had moved into an extreme overbought territory at the end of April and had also done so previously up to that point on lighter and lighter volume.
Probably the remaining shorts had covered their last positions near the end of April, so that when the decline started moving into early May, there was a big air pocket under the market, not enough willing buyers and not enough short covering to support the market.
I had a newly developed target today on the SP500 of near the 1127 range because this range would fill an SP500 gap that existed on March 5, 2010. Not only that but, 1127 is a key area of support in terms of uptrend line that had defined a portion of this bull run so far.
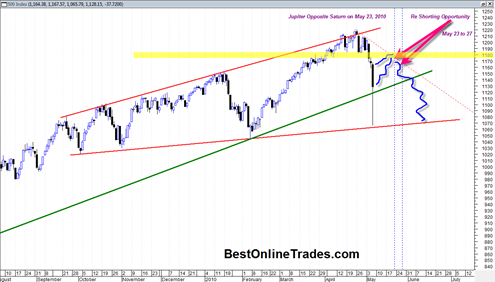
BestOnlineTrades correctly identified an ascending broadening wedge several days ago and this has proven very useful as a ‘map’ of sorts in determining how price action would play out.
In fact the price action today was somewhat consistent with the ascending broadening wedge I had indentified previously. But I must admit I did not at all expect the bottom boundary of the ascending broadening wedge to be touched in one day and on an intra day basis.
I closed all my shorts today (and somewhat too early before the big crash today) because I am expecting an extended bounce all the way back up to topside down trending resistance. This bounce could take the form of a rising wedge ( I am hoping) and may set up one of the second great shorting opportunities of 2010.
I suspect the market will gap up higher on the open tomorrow on a strong jobs report, and then transition into a choppy uptrend into resistance. Look at this chart to see the guideposts.

The resistance range is shown in the yellow shading and would coincide with the market trading up in rising wedge form towards that resistance. Also significant is that we have a major astro aspect kicking in on May 23, 2010. So the most ideal scenario for another good shorting opportunity is for the market to trade HIGHER into end of May perhaps near the May 23 to May 27 2010 time frame.
If the market does that then I will be looking for another good shorting opportunity.
At this point I do not know if it is worth trying to play the volatility between now and that time frame because it may be too choppy. But for day trading between then and now I am sure there will be good opportunities.