
My sense is that we are at the end game during the next two weeks, the final stage of what I think will be a mega crash. I sense this from my extended observations of the 1987 price chart versus the 2010 price chart. The structures are so similar it is not even funny.
Just to sum up some of the reasons why I believe a mega crash is likely to occur:
- The rally since the March 2009 lows was a low volume manipulated rally by government interests. Markets can only be manipulated for brief periods of time but ultimately they tend to resume to where they were trending before the manipulation and reflect real economic realities again.
- The market right now is cranky, in a bad mood, and has a bad looking nervous tape. That is not the type of action you like to see for new bull trends.
- The rally from the March 2009 lows was arguably an ‘automatic rally’ given the nature of the severe plunge into 2008. The downside follow through after automatic rallies are complete in my observation has many times led to crashes (at least in individual stocks).
- IF we are really about to enter a massive deflationary economic spiral it is not uncommon for the market to signal this fact with some type of ‘shock and awe’ campaign. A big crash would do the job and signal to the world that the market has started to price in a zero growth deflationary environment. The market may suddenly start to build in price to earnings ratios of 1 to 5 instead of 15 to 20.
- The Jobs Killer
- The pattern similarity to 1987
- The Astro Cardinal climax aspects which kicked in late June and seem to be exerting some serious downside pressure on the market now.
- Almost no one is calling for a devastating rock bottom crash where prices go down and STAY DOWN. Actually this is not entirely true. Richard Russell has been talking about a crash as well as Bill Mclaren. Bob Prechter is bearish and looking for much lower prices but I have not heard him specifically talking about a huge down move happening in the next couple of weeks. Perhaps he has for his paid subscribers (see elliottwave links on left sidebar). There have been plenty of more underground type sites and blogs looking for a crash however, but not too many mainstream sources from what I have observed.
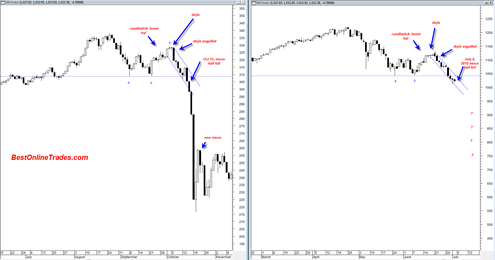
I have spent many many hours staring at and studying the nuances of the 1987 topping pattern as compared to our current topping pattern. The pattern similarity is strikingly similar. The candlesticks and engulfing patterns are similar. And the final act, the subtly down sloping decline leading to a vertical decline is also similar. We are situated right now in the subtly down sloping decline. The most important question now is, do we transfer into a persistent vertical decline as 87 did. The time similarity is what is missing. The 2010 pattern is taking longer to form and this may or may not destroy the correlation.
But regardless, I have to conclude that the next two weeks must contain the epicenter of the decline, otherwise I will have to conclude that the pattern similarity is a total failure. It just cannot wait any longer given the current pattern similarities. Many stocks right now are in a stance were they have become significantly weakened and are at a juncture where this weakness can transfer to either a final bottom or a climax vertical selling point.
I should say that the absolutely worst thing that can happen to the bears this week is a bullish move with follow through above 1070. That would really cause me a lot of concern for the bear case. Any rally this week or preferably on 7/6/2010 should immediately be retraced the next day to keep this acceleration going properly. A one day July Holiday low volume rally on Tuesday 7/6 would go a long way to recharge bearish energy to the downside the rest of the week. I am thinking that if we do rally 7/6, it would stop ideally near the 1050 range.
There is some talk and concern that the current chart structure resembles that of the July 2009 period where there was a famous head and shoulders topping pattern that failed very badly. That was indeed a horrible failure and it failed very fast with persistent price rises and gaps upwards. I don’t see this happening again now because at that time the 50 DMA was crossing ABOVE the 200DMA and now the 50DMA is crossing BELOW the 200DMA. I suppose it is still possible we get a massive failure but as of right now I do not see it. As I already indicated above if we do rally early this week, I do NOT want to see strong follow through.
The Psychology of the Decline
When I look at the 87 price chart structure against the 2010 structure the parallels are astounding. In a previous post several weeks ago I indicated that the market had to ‘recharge’ and get RSI (Relative Strength Index) values back up to the 50 to 60 range as fuel for another huge drop. This is exactly what happened in 1987 and we did see the market recharge in 2010 in very similar fashion. As it turns out we managed to get back up to 53.5 on the RSI on June 21st, 2010.
But since then (June 21st 2010) we have started to cascade down in persistent slow momentum fashion just like in 1987. It has been a slow gradual slide down kind of like sliding down one of those water slides. The key point however is that once you reach the end of the slide you drop off the edge of the slide and gravity takes over. Gravity took over in 1987 and prices dropped VERTICALLY for 3 to 4 days. It was just those 3 to 4 days that marked the epicenter of the panic and the real price destruction. The previous slide in prices was just the preview.
From a psychological perspective it is fascinating how the initial slow momentum price slide causes many to either go long or stay neutral. Certainly this is understandable because it is very risky to take new short positions after an already overextended slide down. The perceived risk is less to go long because of the oversold nature of the tape.
Speaking of going long, it is important to recognize also from a psychological perspective that those who went long during the blow off bull run from February 2010 to April 2010 were quickly trapped after the May 6, 2010 flash crash. Since then the market has rallied and each time those who were trapped have been trying to get out. It has gotten to the point now in the trend were I think those longs who are still deeply underwater will desperately try to get out on ANY rally so they can walk away home free. The problem is that if the rally does not come then they may have to unload all at once to get their money back.
I think people have not forgotten the 2008 decline. Price has memory. That is why I think this decline will be faster because people already know how quickly things evaporated back then. If we decline badly again they will not want to make the same mistake of being slow again to take profits or recoup at least partial profits. They will want to get out faster this time.
Uh Oh the Astro Again
We already know that the very powerful cardinal climax aspects have initiated end of June and opened the window towards extreme price negativity. Since the last part of June the market has declined in persistent fashion.
On October 15, 1987 the moon was half full. It was progressing towards a new moon on October 22, 1987. So basically the epicenter of the crash was during this period of a half full moon progressing towards the new moon. The new moon marked the bottom of the crash or close to it at least.
What is fascinating to me is that the current stance of the 2010 price chart is at almost the exact same point in time of the evolution of the 1987 pattern AND the phase of the moon is almost identical as well.

So if the correlation continues it could mean that we are about ready to engage on a relentless crash right down into the new moon solar eclipse of July 11th, 2010. It is mind boggling to me how all these little pieces fit together.
To me this looks like the end game. How low we actually go is the most difficult part to forecast and probably impossible. If there is a true panic then how low is low? I mentioned in previous posts 950 on the sp500 or an intraday slide to 900 and then close at 950 range. This seems like a reasonable forecast. But panic is not reasonable.
So the guide for me will once again be the 14 day RSI. As indicated previously the power zone is below the 30 range. If I am correct on this mega plunge this week then the depths of the crash low should be somewhere between the 10 to 25 RSI level.

So it appears this is the end game. God Help us all. It is never the end of the world. But if we do get a really large drop I can only imagine the havoc that will be created in Washington and world wide. I suspect a lot of people will be very angry and with good reason.
But the problem is that markets do this kind of thing all the time on the 5, 10, and 15 minute charts. It is very rare to see it on the daily charts. Nothing goes straight up and nothing goes straight down. Despite the attempts of the current administration to prevent a ‘financial crisis from ever happening again’ they will happen time and time again. It is just a natural occurrence and with each crash and financial panic comes a ‘cleansing’ of sorts and the beginning of the seeds of healing and new economic progress down the road. The more governments try to manipulate the economy the worse the eventual correction becomes.
Surreal
It is going to be surreal to me if the market continues to decline in a fashion as I outlined in this post. I mean how often does the market actually do what you really expect it to do ? Maybe it is a 50/50 proposition.
If it does, then Monday July 12, 2010 may be our black monday and the epicenter of the drop and the final low that will allow the market to start base building again and trading sideways to higher.
An accelerated drop into mid July would set the stage for a sideways to up rally into the very bearish September October period which may correlate with another drop at that time below the 666 sp500 March 2009 low. But that is looking way to far ahead at this point.
First, lets see if surreal turns into real this and next week. If it does turn into real then I would expect to see major major front page headlines in full bold face type on all the leading newspapers.
Now that I think about it I might just buy myself a copy of the New York Times each day of this week and next to see what the coverage is. If there is an issue that covers the stock market in a full front page spread with a large photo and very fat oversize bold type, then that is probably the signal that the decline has reached its maximum point and climaxed.
good post, I am ready for it.
Tom another excellant post…
I think the comparison with the 2008 crash also may be worth looking at…..(but that was on a weekly scale)
I’ve shown this on my blog…
also last week you alluded to a small rebound, this apears to be occuring, and again fits in very well with the big picture bearish scenario…I would guess S&P may struggle over 1040,,, but do not rule out a spike to 1060ish.
Yes it does look like this is the ‘holiday cheer’ rally… Will be interesting to see if it closes near the highs today just like in 1987. I just calculated that 1045 would be an ideal close for today to help to keep the RSI constrained enough. 1060 seems possible too.. but I suppose the close is all that really matters at this point and also the volume.