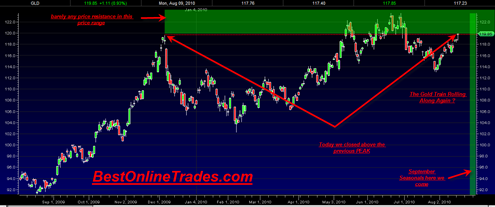
The SPDR Gold Trust (ETF) closed today above its previous major spike peak high of the 12/2/2009 and 12/3/2009 period. This is significant. Volume was seriously lacking the GLD ETF today however, but still we must give it credit for a solid close near the top of the range.
The GLD ETF has now positioned itself to enter once again a zone of minimal previous price resistance. This is very important because previous price resistance can be like quicksand, hindering ease of movement in price.
So higher moves in the GLD ETF from here going forward have the at least the potential to be fast and furious. The gold market seems to be feeding off of paper equity market weakness like a vulture feeding off of a wildebeest carcass in the African Desert.
Gold is trading with the Relative Strength Index well above the mid 50 range and in bullish territory. A move into the powerzone above 70 could lead to possibly explosive topside moves.
The gold price seems to be ‘the trade’ right here and now. It has a huge almost one year cup and handle pattern, the handle of which seems to be finishing now. It does not have a messy sloppy extended trading range like the stock market does. So why still the obsession with the stock market? You probably already know the answer. Because of the still astonishingly huge number of stake holders with a vested interest in pumping the market up. Needless to say it is not working too well. The stock market is in a wide swinging trading range with no real trend.
Gold seems to be sensing this and is basically saying right now “Lets get the heck out of Dodge”.
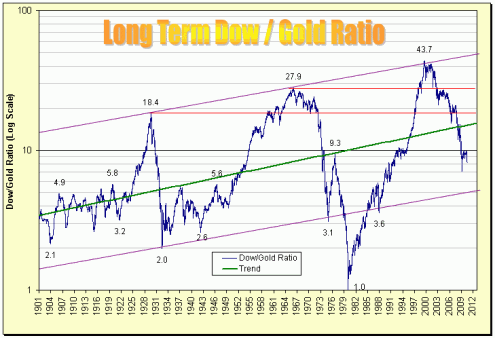
From a super long term basis the Dow to Gold Ratio also seems to be speaking loudly. The long term Dow to Gold Ratio Chart puts the ratio at about 8.4 right now.
If we assume that the gold price will blast higher to 2000 during the next 6 to 12 months and that the Dow Jones Industrials would stay at 10,300 then it would put the ratio at about 5.00 which is right at the bottom channel line of the 100 year Dow to Gold Ratio Chart.
Chart source: Sharelynx.com
If the DJIA were to decline from here it would change the movement of the ratio of course but this chart is definitely one to keep in mind assuming gold can get to 2000. This long term chart suggests that the 2000 range of the gold price is an ideal major pausing point for the gold price. Perhaps it would lead to that 50% correction in the gold price I referred to in a much earlier post.
So the stage is set a couple weeks before September. Signs seem to point to a massive blow off type run in the gold price. And remember this important fact… In many commodity bull market type runs, 90% of the move occurs in the last 10% of the time. So if we are in the last 10% of the first major leg up in gold (before the 50% major mid term correction), then the upcoming price advance could be quite the sight to behold . . .
Finally if you look at a simple table of gold market returns versus Dow Jones Industrial Average Returns it should be pretty clear who is winning this battle. And yet mass public ownership let alone investment fund ownership of gold as a total percent of paper assets is still at record lows ? Why?
| GOLD | DJIA | Winner ? | ||||
| 2000 | $272.65 | -6.06% | 10786.85 | -6.18% | Gold | |
| 2001 | $276.50 | 1.41% | 10021.5 | -7.10% | Gold | |
| 2002 | $342.75 | 23.96% | 8341.63 | -16.76% | Gold | |
| 2003 | $417.25 | 21.74% | 10453.92 | 25.32% | Dow | |
| 2004 | $435.60 | 4.40% | 10783.01 | 3.15% | Gold | |
| 2005 | $513.00 | 17.77% | 10717.5 | -0.61% | Gold | |
| 2006 | $635.70 | 23.92% | 12463.15 | 16.29% | Gold | |
| 2007 | $836.50 | 31.59% | 13264.82 | 6.43% | Gold | |
| 2008 | $869.75 | 3.97% | 8776.39 | -33.84% | Gold | |
| 2009 | $1,087.50 | 25.04% | 10428.05 | 18.82% | Gold | |
| 2010 | $1,500.00 | 37.93% | 11000 | 5.40% | Gold |
The table shows annual closing values and percent return for the year for the Gold Price versus the Dow. Gold has won 9 times out of 10 (I speculated on the closing values for 2010 however).
The interesting thing about the annual returns for the gold price is that we have not seen as of yet a massive one year annual return of something like 70 to 100%. Commodity markets are fully capable of delivering that type of return if the environment is right and keeping in mind my previous comment about the 90% of returns in 10% of the time behavior. . .


