
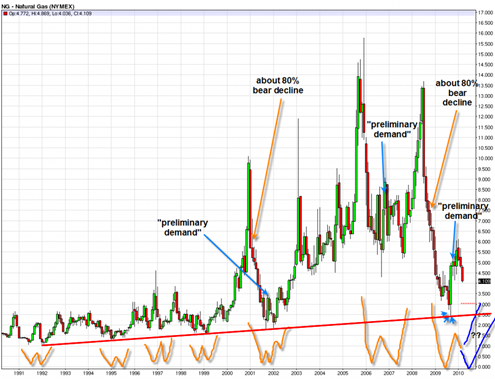
 This is a quick editors note regarding my previous post on the long term natural gas futures chart. I forgot one very important part of that long term chart. I forgot to draw the long term up trendline (long red line) that has been in force since 1991 time period. This is a crucial element of the long term chart and the guidance I provided regarding a potential W bottom formation eventually taking place.
The tendency has been for natural gas futures to do a W bottom second step right along this long term uptrendline and so it helps the argument I make that natural gas wants to do a W bottom in the months ahead.
Subscribe to BestOnlineTrades updates for more on this long term chart in the future (subscribe form at very top right of this site).
This is some excellent work on pointing out the long term trendline! This is going to be a very high probability play.
Thanks!
Thanks for your comment. Yes it has the potential to be a very good probability type play. But the key will be patience, longer term chart work and being very careful not to be too early. Being too early before a bear market ends can be very very costly. So here at BestOnlineTrades Labs 🙂 (hey! I like the sound of that, kind of like google labs 🙂 ) , we are watching the Natural Gas Contract and the UNG ETF as well in the months ahead to see if we can spot the clear signs of a true bottom…
Also keep in mind that just because that long term trendline exists, does not necessarily mean that the price of natural gas has to fall down and test that line again. It seems probable for it to do so, but as usual we need to let the market decide…