
The words that make up the title of this post are not mine. They are Larry Pesavento’s words and I happen to agree with him. I continue to believe that this is an extremely dangerous market and that it is an environment of a weak and nervous bid. We literally could start to collapse at any time. We were able to drop almost 1000 points in a handful of minutes on May 6, 2010. Dropping 2000 points in double that time does not seem impossible either. This market is building a catapult or a spring board for the next big move.
I have spent a good amount of time over the weekend contemplating the bearish and bullish sides of the market and so I am just going to write out a potpourri of thoughts in the paragraphs ahead and also comment on today’s closing price action.
Why Should the sp500 go to 1150?
I think it is an important question. It seems like every technician in the world expects the market to zoom to 1150 to create a right shoulder of a larger head and shoulders topping pattern. I admit I have considered this possibility and wrote about how I was expecting that as well after the reversal of a week ago.
But after some contemplation I am starting to think this is much less of a possibility and that the advance that started a week ago may have either topped out today or by the middle of this week.
Why?
The sp500 going to 1150 or 1170 would make it much too easy for those who are currently trapped to recoup a large portion of their losses. Since when is the market Mr. Santa Clause giving previously greedy bulls all kinds of second and third chances to bail out break even ? It does not make any sense for this market to do that if it is in a persistently impulsive bearish trend as I predict it is.
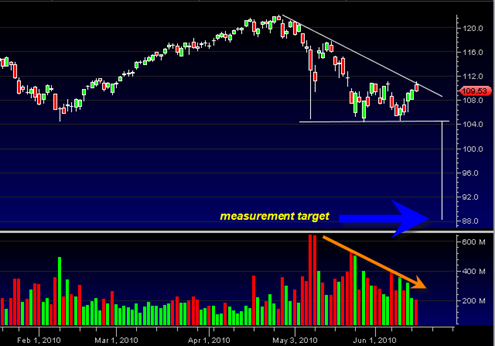
We are Dealing with a Descending Triangle
On the sp500 we are dealing with a descending triangle which is a bearish pattern that implies there is a large buyer at 1040 that has supported the market, but there is a persistent down trending force of sellers that should eventually overtake this 1040 buyer and eventually successfully break below it.
That is assuming the descending triangle functions properly and according to spec. Some descending triangles do fail. But a lot of them succeed too. Personally I believe this one will succeed when I combine it with other analysis and astro (see below). By the way, one way they can fail is when you see a squeeze UP right out of the apex of the pattern. If we do that, the market will still have to contend with the very strong downward force implied by this pattern and so a squeeze up like that could only be a temporary affair.
One characteristic of descending triangles is that they have rapidly contracting volume. Then upon reaching the apex you can see a rapid fire break down on a huge surge in volume to mark the break. Once support is broken it is also common to see a huge surge back UP to test the new resistance (in this case it would be 1040). Right now as I look at the descending triangle we are situated right in the SWEET SPOT for a big break down to start occurring as we are not completely into the apex yet.

This Rally should be Short Lived
The other concern I have had (and I am sure many other technicians as well) is that this bounce which so far as been in force for 5 days, could last for a month or two before the market eventually rolls over. This point goes hand in hand with the 1150 argument.
My take is that this should not be the case because I view this decline as more impulsive. A move that has initiated after the topping out of a 1 year ‘automatic rally’ from the March 2009 lows.
Many comparisons have been made between the slow topping process of 2007 and the current decline. That top in 2007 was made after a 4 year advance since 2003. But again, the recent late April 2010 top was made after an automatic rally already deep in bear market territory. For this reason and several others I have not mentioned, I think the speed of this decline will be more rapid and persistent and will invalidate the ‘1150 to 1170 that takes forever theory’.
Very Significant Astro Aspects June 17 to 26, 2010
There are a bunch of very negative astro aspects from the period June 2, 2010 to June 26, 2010. So basically we are talking the next two full weeks of trading or about 10 trading days. 10 trading days with respect to the structure of the descending triangle fits quite nicely.
Of course any astro aspects can fail and they do. But if the persistently negative trend as well as the speed of the trend is to continue then the astro aspects would fit the previously discussed pattern quite nicely.
Someone did a fantastic post on some of these astro aspects over at traders-talk.com and I highly recommend you look at it. Based on this analysis it could be possible that the real decline will not get true momentum until after this week. On the other hand, the options expiration this Friday could help the volume enough to push the market over the edge. Perhaps there will be a clearer picture as the week progresses.
Volume Sell Signal on the SPY Today
There were a bunch of ugly looking candlesticks on all the major indices today. Plenty of reversal hammers, a very bearish gravestone doji on the NYSE and also during mid day on the SPY ETF there was an abandoned baby reversal candlestick pattern which is as of yet unconfirmed. What is missing from all of these candlesticks are very long tails which in general can make them a lot more reliable. But still, reversal hammers they are.
The SPY today TESTED the 5/27/2010 price swing on 30% less volume and closed under the high of the 5/27. This is a volume sell signal and implies that the SPY will trade back down to the bottom of this range near the 105 level and likely break it per the preceding analysis in this post.
If the market is able to break under 1040 level either later this week or early next week, be prepared for some massive volatility in both directions. But ultimately I believe the final resting point will be will be significantly more DOWN from current levels.
Hi Sir.
My thought for tuesday
Hi traders,
My thought for tuesday.
Test EMA200 and close below friday close. Wasn`t a good close but bears need to close hourly below 1077.
Key suport short-term range [1077,1082]. Close below 1077 expect 1065 possible extension to 1050.
Stochastic overbought conditions Rsi testing lower band neutral zone.
Blue Trendline tuesday (15/06) sitting 1098.05
Resistance Key area [1100,1106].
Resistance Key level 1115 reversal trend short-term
Key level dowside 1077
Chart here http://3.bp.blogspot.com/_MJqKtyMMr28/TBaTSqkDEuI/AAAAAAAACC8/AmnDJUaT1ws/s1600/spx+15062010.png
Chart 2 http://4.bp.blogspot.com/_MJqKtyMMr28/TBaTpcSQIHI/AAAAAAAACDA/t7BkjqQlRN0/s1600/spx1+15062010.png
All update here with last weekly and monthly thought
http://followmarketrend.blogspot.com/2010/06/spx-daily-market-thought-15062010.html
Have a nice week and good luck for tuesday.
Yes Tom,
Have shorted FTSE at 5232, and will short S&P at 1114 (will not wait till 1118).
Cheers,
Shrihas