Just yesterday I was talking about how on the emini futures there was a possible chance or setup for a breakout type price action. Later on that evening as I was looking at the final numbers for the day and looking at the volume numbers for the SPY ETF I came to the exact opposite conclusion.
It seems like that is the most difficult thing to do in the field of trading and technical analysis, to change one’s opinion quickly if necessary and take a complete opposite stance on the market. Maybe it is not the most difficult aspect of trading but I would say honestly that it probably ranks near the top as far as skills to master when trying to time the market.
So you see yesterday I had the idea that the price was still constructive on the emini futures and that we appeared to be trending up in a somewhat ascending triangle pattern. I made the point that price had not given up that much ground since early May and could be indicative of internal market strength.
Well my news analysis now suggests that we probably made a pretty important top as of yesterday. By important top I mean that it may be a while before prices start trending up strongly again and resume the uptrend we have been in since March.
There are a few reasons why I am thinking this way.
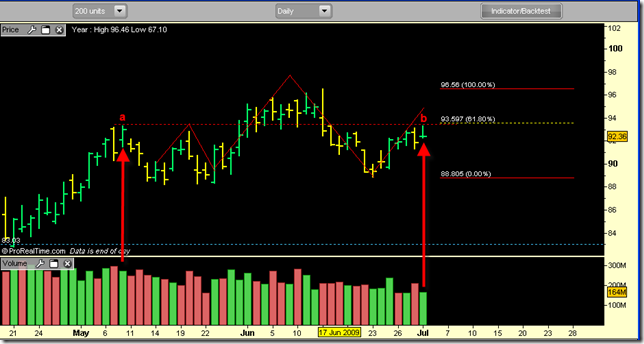
The first reason is that we may have a head and shoulders topping formation here. I drew in the left shoulder, head and then part of the right shoulder. A lot of times the right shoulder can be equivalent in terms of time to the left shoulder, but not always.
The second reason why this could be a top is the fibonacci factor. If you calculate the fibonacci retracement levels from the 15th of June to the 23rd of June you get a 61% retracement of the decline that was almost nailed exactly yesterday to the tick. The fact that we failed up there at that level is not good in terms of keeping the uptrend going, and you will see what I mean in my third reason.
The third reason why we are likely in down mode now has to do with the volumes and the swing points. If you look at the chart and see where I labeled swing point ‘a’ and then swing point ‘b’. Swing point ‘b’ tested swing point ‘a’ on 40% LESS volume and then closed under that level. That is the classic definition of a sell signal when you are working with price swing points and volume. The ‘b’ swing point tested point ‘a’ only with one tick which is pretty amazing. The high of swing point ‘b’ was 93.23 and the high of swing point ‘a’ was 93.22. Sometimes they get tested on just a fraction of a point, but those are still valid tests.
So I can tell you the fact that we tested swing point ‘a’ on 40% LESS volume, and also turned around right at the fibonacci 61% retracement level is a sign to me that we are going downtown and we will probably break support for a deeper correction.
The two highest volume swings on the lower end of this trading range are 244 million and 182 million. The June 23rd level is the first upcoming test.
Right now it is 3:30 PM and we have yet to see what the downside volume is today on the SPY ETF. But so far it looks like a pretty bad sign of weakness and more downside to come…


1 thought on “The Market Lives and Dies at the Swing Points”