
There has been a lot of talk about the head and shoulders topping formation in the broad market indices in construction since November of 2009. Head and shoulders patterns are reliable patterns but they are definitely not guaranteed. Sometimes they do fail. I believe this one will fail because it does not have enough symmetry and the right shoulder has dragged on too long and been too complex.
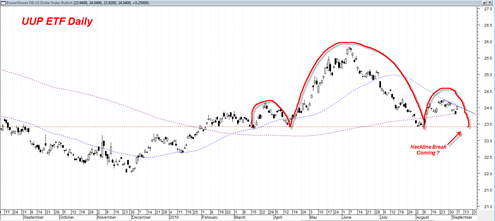
Ironically there is another large potential head and shoulders topping pattern in the PowerShares DB US Dollar Index Bullish ETF. I think it is ironic because if the UUP head and shoulders topping pattern turns out to be valid it will likely have the exact opposite implications that the supposed head and shoulders top in the sp500 was suggesting.
A break down through the neckline in the UUP ETF in the days and weeks ahead would likely lead to an inflationary pumping of both the stock market and the gold market.

The head and shoulders top pattern in the UUP ETF is not yet confirmed and there is still a risk that it may fail, but for now it looks like a pretty clean pattern to me and seems to suggest a big drop in the UUP for the month of September.
This would likely correlate with a strong move higher in both gold and the stock market. I must admit that to see both gold and the stock market trading higher together in sync again seems somewhat counter intuitive, but in previous years that correlation was quite strong as long as we continued to see a falling dollar.
If this neckline break does occur in the UUP ETF, then I think it is fair to say that the resulting upward thrust in the gold price will be a real bull market move, whereas the upward thrust in the stock market is likely to be ‘fake’ in the sense that rising equity prices will likely eventually suffer the ‘tax’ of higher inflation.