
If you have been following my posts you probably know exactly what I am going to say in this post. The bulls won today very clearly and it was a decisive day in terms of volume (276 million shares on the SPY) and price strength at resistance. This was not necessarily blockbuster volume but it was surprisingly robust especially considering the volume pattern since late April 2010. I believe it is time for the bears to raise the white flag and move on. The market is also starting to break out above the diamond chart pattern I talked about yesterday and should now be implying that this diamond pattern was a reversal pattern, not a continuation pattern.
The bearish MACD histogram setup was not confirmed today clearly. Instead we now have a bullish triple P pattern in the MACD histogram and it will be confirmed if we close above 1097.50 either tomorrow or next week. Instead of the MACD failing at the zero line it now looks like it wants to blast above the zero line which is quite bullish. In addition relative strength index is itching to blast higher than the 50 range midpoint, another bullish sign. The summation index which I was concerned about yesterday because it ticked upwards did so again today and clearly shows new momentum is now topside.
Staying with the bearish case because of ‘bad news’ is usually never a good idea. The problem with news is that the mainstream financial media chooses which news items they believe are the most important. But in many cases or perhaps most cases the news items they choose as headliners on a daily and weekly basis are usually just a representation of the crowd mentality and usually the crowd is wrong. So everyone gets sucked into these major headliner news items (ie. Europe debt problems, oil spill) but these news items are not necessarily what the stock market really cares about. The market cares about supply and demand and ultimately the battles will be won or lost based solely on those factors.

The current setup in the market reminds me a little bit of 2003 when the market was all nervous about us going into Iraq to start war. There was confusion about whether the dropping of the bombs would tank the stock market or rally the market. As it turned out it caused the market to rally big time. The series of bottoms leading up to that 2003 turning point was a series of retests each time on lighter volume. This is also what I have seen since the first May 6, 2010 low. A series of lows each on lighter volume. And now we are seeing an upside expansion of volume. If it walks like a bottom, talks like a bottom and acts like a bottom it probably is.
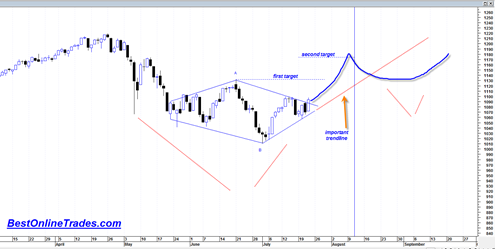
The volume today combined with the markets piercing of its bear market down trendline says to me that this market now wants to oscillate higher in two stages. First to 1130 and then to 1170.
Once again I have to refer back to the mid 1970’s sp500 bullish scenario as the best possible longer term forecast because of the fact that our current market has so far only managed to accomplish a meager 38% retracement of the entire rally since March 2009. Can you believe it! After those enormous gains since March 2009, all the bears can get done is a 38% Fibonacci retracement! In my opinion this has to be respected and a sign the market is telling us something. It wants to go higher in a big way.
There is still a bit of confusion on this August 10th to 12th cycle date. It now looks like this series of dates will be a market high instead of a market low. It is possible they will be completely ignored as well.
If there is still one bearish scenario I can hang onto then it would be a rally into this mid August time frame (which is typically low volume month) and then a decline into September.
Seasonally September is not good at all for the stock market and so there is still downside risk assuming the market churns higher to my first and second targets as shown in the chart above.
If the market truly is strong enough then it would likely get a decline going in September that could make the handle portion of a cup and handle chart formation as drawn in the chart above.
By the way, remember that chart of the QQQ’s I drew up indicating a massive head and shoulders bottoming formation? Well the pattern is still intact and could start to evolve bullishly. It is going to be very important to watch the neckline of this potential pattern as it could lead to an enormous strong buy signal in the months ahead.
I thought it was interesting that Bernanke made a forecast for 7% to 7.5%unemployment rate by 2012 in his recent comments this week.
At its latest meeting, in June, the Federal Open Market Committee, the Fed’s top policy-making arm, slightly lowered its growth forecast for the rest of this year, to a range of 3 to 3.5 percent. It expects growth of 3.5 to 4.5 percent in 2011 and 2012, and the unemployment rate to drop to 7 to 7.5 percent by the end of 2012.
Maybe Ben Bernanke (hi Ben!) read my post on the MACD of the unemployment rate? In that post I draw conclusions that the unemployment rate is set up to decline in the year ahead which would be potentially quite bullish for the market and be consistent with the mid 1970’s scenario I have been talking about.
This has been a hard fought battle since end of April 2010. The bears made some good ground but now the bulls seem to want to continue their old ways.
The next important battle line is the 1130 area on the sp500. How the market reacts at this level and also in relation to the new uptrend line I labeled in the chart above as ‘important trendline’ will be key.