
There is a somewhat untold sp500 story that I would like to talk about in this post. It has to do with the recent correction we appear to have recently completed relative to the price advance that began on 9/3/2010.
We hit two significant price swing lows in recent months on the sp500. One of them was the March 16, 2011 low of 1249.05 and then there was a follow on higher low of 1258.07 on June 16, 2011. Both of these swing lows were within the 38.2% Fibonacci retracement zone (pretty close to it) relative to the advance from 9/3/2010.
So once again we see that the sp500 was not able to do more than a 38.2% retracement of the entire mega rally that began on 9/3/2010. This is an important fact and points once again to the internal strength and momentum strength of the sp500.

Stocks, Commodities and market indices that can only manage to do 38.2% retracements on longer term time scales are inherently strong and clue in to the good possibility of a new follow on rally that is equally strong (assuming new 52 week highs are achieved).
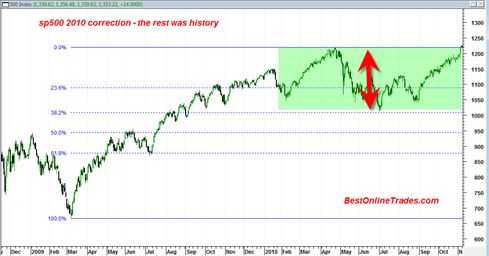
I made a similar observation about the sp500 correction that began in May 2010. This correction that went into August of 2010 was also only a 38.2% retracement. Yes the correction itself was violent (especially May 2010), but that was simply smoke and mirrors. The overriding truth was that the market at that time only managed to do a 38.2% retracement and then in early September 2010 the market took off like the the NASA space shuttle.

There was also a bullish volume analysis during the May 2010 correction that showed the market was getting exhausted to the downside. And interestingly there was also a bullish volume analysis on the QQQ I did recently.
So there you have it. In both cases we see that the market only managed 38.2% retracements and also in each case a bullish volume analysis existed.
We still need to achieve a new 52 week high in the sp500 in the days and weeks ahead (the Transports already have). But I believe we will and then continue higher again in normal trend fashion.
The bottom line?: The current minor 38.2% retracement leads to a possible expansion towards 1600 in the sp500 (eventually). The bulls still own the show and are likely to continue doing so for another year or two.
P.S. In case you have not seen the recent important breadth data, please see the following link. It is an important link because it tells of an enormous breadth surge which can have implications for market action far down the road. We recently saw a huge weekly sign of strength in terms of price. Combine that with the breadth strength and we have the makings here of quite a healthy new bull run… again.
On the 2011 chart, why did you measure from the August/Sept low instead of the June/July low ?
I measured from the Aug/Sept low because that is where the previous correction finally ended and was the most significant turning point.
I suppose could also be drawn from June July low as well, might not change the parameters too much.