
The bounce in the stock market arrived right on schedule today. It was big and dramatic however the volume did start to dry up today and I suspect it will continue to do so during the next 5 to 10 days as we move from a high volatility state to more moderate volatility state.
I still believe we are setting up for a historic crash that may be so severe it will really cause an unbelievable amount of shock (and fear) to the system and could potentially on its own be a catalyst for a return to economic weakness and skyrocketing unemployment.
We appear to be entering the most devastating leg of the bear market that began in the year 2000 and from my understanding of Elliott wave this leg down should be relentless and persistent perhaps containing multiple crashes within and almost behaving like a ‘bull market in reverse’.
It is the opinion of BestOnlineTrades that the market should now be traded as if we are going into a new bull market in REVERSE.
There is a larger overall market structure which has been pointed out by the folks at Elliott wave and a few others but I think I will have to devote an entire post to it because its implications are very profound. The technical argument is basically that the entire market is building a very large head and shoulders topping pattern since the year 2000 top. But what is most significant about the pattern is where its measurement rule would eventually send the market. How about zero? Can you believe it? Well its true, the measurement implication of this large head and shoulders pattern, if true would send the market indices to zero or single digits at best. More on that in a future post…
But now onto three scenarios I see for the market going forward.
I already mentioned this key date (in my opinion) of May 23rd to May 27th 2010. I still believe there is a good chance that the market will rally up into that window. If it does, it would be in my opinion the most bearish possible scenario for the market.
By the way I should mention that I am not at all an Astro Trading Expert. However I do follow other market leaders who use astro and then combine my own analysis with the Astro aspects to attempt to ‘connect the dots’.
May 23rd 2010 is the Jupiter Saturn Opposition. The last time this opposition occurred was in Mid July 1990. On that date Iraq invaded Kuwait and the USA went to war. The SP500 double topped on that date as well and went into a 20% decline and recession.
Despite my current focus with May 23, 2010, I still think it is important to be flexible with the length of time of resolution out of the current volatility. However, at least for now I am sticking with my ‘10 days of volatility contraction’ into May 23, 2010 scenario before the fireworks start again.

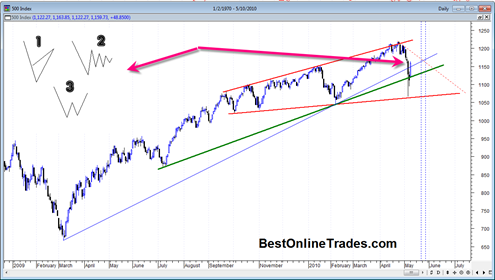
If you look carefully at the chart you can see that the price action in the last two trading days (including today) has managed to spring right back up into the long term uptrend as defined by the solid blue trendline. The market has already completed a fibonacci .618 retracement of the decline that began in late April. So I suspect extensive further upside is limited at this point.
At the top left of the chart I have drawn in three potential price scenarios in the upcoming 2 weeks. Number one would be a rising wedge that has a very steep slope. Number two would be a triangle that compresses into a very low volatility state and number three would be a ‘W’ bottom formation that forms a double bottom, then attempts to rally, but then fails on an attempt to make a new high.
My most preferred scenario is number 1 because it would be consistent with the 1929 crash scenario out of its ascending broadening wedge formation and would seem to have the ability to occur within the shortest time span going into May 23, 2010.
Scenario 3 would be very similar to the 1987 crash scenario but would likely take much longer to form and cause impatience on those looking for a crash right away. But Scenario 3 would possibly fit better with the most bearish astro time frame of July and August 2010, where the very bearish cardinal climax astro transits exist.
When I look at the gold price structure at the moment it seems to be telegraphing that the market resolution out of the current pattern will occur sooner rather than later. Why? Because the gold price looks like it wants to get a massive breakout going as it hugs its all time highs. This would lead one to conclude that the next round of downside volatility in the stock market will come sooner than most expect.
So one really has to take the market action on a day by day basis and see how it builds the next structure. A break below the solid green trendline in the chart above will be the first sign that things are moving towards a severe decline phase again in my opinion.
The market has already shown us an enormous sign of weakness and has shown us its hand. We must respect that signal and take it to mean that part two is coming soon. We are dealing with a ‘no bid’ market here because liquidity is quickly evaporating. Market regulation and rules are suffocating the free flow of capital. It is this type of environment that makes the market ripe for a very severe crash.
I really believe that we have the potential to see a very severe, fast and swift down move in the market that is so fast and ferocious it will simply defy all possible previously held beliefs about what this market is capable of.
We might see a very persistent and relentless series of down moves that do not show any interim bounce until the market is well below 900 on the sp500. In fact I would not be surprised to see between 820 and 650 on the sp500 by the time it is all over.
But the key will be the timing !!!!
If we do see such a crash I suspect once again it will be ‘investigated’ and determined if the trades were valid and maybe new regulations or cancelled trades will come to fruition. The powers that be will do everything they can to stop crashes and panics. And yet the entire rally that began since March 2009 was a government manipulated rally and is part of the reason why it will probably be retraced so quickly.