I recently downloaded the Track n Trade trading platform from Gecko Software and wanted to write this brief Track n Trade Review because there are a few features this software has that I am excited about.
I downloaded the demo to my PC which took about a minute or so and then went through the setup routine all of which was pretty much painless. The install was clean and after I started the program the log in just required my email and a password. When I first went to the site to download the demo I did not have to fill out any personal info or my address or email or anything like that, so that is a plus.
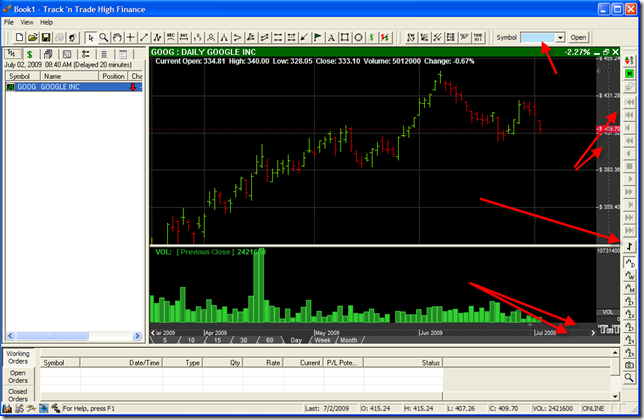
Here is the main screen that comes up after you start Track n Trade:
To see the chart of any stock just type in the symbol in the top right hand corner. The data loads the prices and depending on your internet connection you will see the chart probably within 5 seconds at the most.
First Impressions
My own first impression of the look of the chart, the price bars and the overall clearness factor is pretty good, in fact it is one of the better charting interfaces I have seen. It is razor sharp and the attention to detail is clearly evident once you start working with the interface a bit. The current price that the stock is trading at is highlighted in with a red box on the Y axis and a long horizontal red dotted line pans all the way across the screen to help identify if the current trading price has hit any support or resistance zones.
You see all those red arrows I drew on the chart above? Well I did it because I wanted to point out a very important thing to master with Track n Trade and that is the scaling of the price chart. On the Y axis there are two vertical zones. You can clearly see them spilt with a vertical dotted line. Each zone when you click and drag in that area will either pan the entire stock chart up and down, OR it will compress or expand the chart. The same holds true for the X axis. This is important because at first it may seem difficult to master the scaling of the chart, but it is actually quite easy if you follow what I just said.
Speaking of following what I just said, Track n Trade has all sorts of quick and easy video tutorials on all aspects of the software that will get you up to speed FAST. So I would not worry about a big learning curve with this software. You should be up to speed pretty quickly.
The Indicators on Track n Trade
I really like the clarity of the indicators, the time frames tabs and just the general very professional appearance of the interface. I happen to be a huge fan of volume and I can tell you that the volume bars are very clear on the chart and large enough easy viewing. Too often on many free online charting sites volume is just an afterthought, not with Track n Trade.
Adding or deleting new indicators or options right on the chart is very easy and can be done intuitively with a click of the RIGHT MOUSE BUTTON. I like that. It saves time and makes the platform more intuitive. I was easily able to add or delete new indicators with a right mouse click. Also I should point out that one can very easily increase the size of the indicator display area to cover the full size of the charting interface. This is extremely important because it enables you to see with razor sharp clarity exactly what your indicators are telling you and whether or not they have crossed or broken certain key technical levels.
Track n Trade has all the standard important indictors you expect to find and plenty of extra ones too. They have a pretty neat elliott wave indicator that you can map right on the chart and they also have the standard Fibonacci indicators as well as Gann Fans. There are a couple other nice indicators that let you quickly see how many days have passed between two points or percent between to points as well.
On the very top left of the charting interface there are 7 tabs that when clicked, will show all sorts of information in the left large panel. The first one shows your stocks watch list. The second one is for buy sell orders to be placed along with detail info about the stock that is currently displayed. The next tab has a bunch of market reports and stats reports on active stocks by exchange and so on. Then there is an RSS tab for displaying RSS feeds within your trading window. The next button is for indicator customization and then the last button has a little note pad for taking notes. I love that little notepad feature, very useful.
One of the Best Features of Track n Trade is…
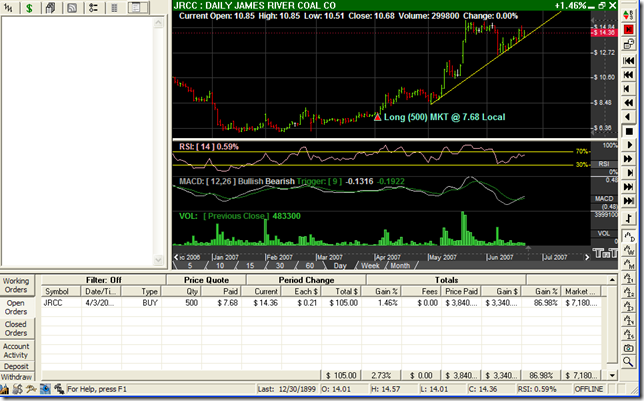
Track n Trade has a superb feature that allows you to essentially paper trade in real time. It is a bit difficult for me to explain exactly how this works unless you try it yourself, but I will try anyway.
In the image above you see those VCR style buttons on the right hand side? They allow you to go back in time on any stock or index and then one day at a time view the next price bar and place buy and sell orders depending on what the signals are telling you. This is really a great feature especially for beginning traders, but also for seasoned traders because it allows you to test your trading skill based on any set of indicators you choose and then to see in real time what your account value is based on your buy and sell decisions.
The problem with paper trading in the markets without this feature is that you have to WAIT days and weeks and months before you will see the results of what your decisions were. With Track n Trade, you can go back in time as far as you want on ANY stock or index and then with VCR like buttons move the chart’s price bars forward ONE AT A TIME to see if any new action is warranted. Great feature!
You can also place your buy and sell orders right on the chart as time moves forward so it seems like you are placing real trades right on the chart. Then, step forward one day at a time and see if you were correct in your analysis, WITHOUT WAITING!
Truly an outstanding feature. I am surprised that other charting programs have not come up with such a feature yet.
The Bottom Line is
Track n Trade is a great piece of trading software with plenty of useful features for the beginning to advanced trader. The clarity of the charts, the indicators, and the bonus features such as the historical trade simulator make this trading software outstanding.
I have seen a lot of trading software packages out there, in addition to all of the online charting systems and I would say Track n Trade finds itself in the top tier of trading software programs. I give it a 9 out of 10 stars with 10 being the best.
You can download Track n Trade right here and try it out yourself.


