
A comment poster recently asked me to take a look at ARMH stock for some clues as to whether it was in a good buy zone. I indicated that ARMH was probably overextended and not at a good risk reward entry point. Sure enough a few days later the stock shot up from 21 to almost 30 in just a few trading days.
I thought about this for a bit and then it occurred to me that the longer term chart structure of ARMH going back to 1998 shows that the stock appears to be once again trading into a parabola formation approaching near vertical price movement.
After realizing this, it then occurred to me that we could very well be dealing with a similar dynamic in the sp500 and would explain the current seemingly ‘insane’ price action that never seems to stop.
The parabolic blow off in ARMH that started in 1999 lasted for 5 full months. Currently ARMH appears to be only 1 to 2 months into its parabolic phase. I am not suggesting that ARMH is a proxy for the sp500. ARMH simply provided me with the clue that a similar dynamic is occurring in the sp500.
Why is This an Important Observation ?
It is important because it tell us that we are in a special market environment with extraordinary persistence. It is also important because it implies that price action should reach near vertical type movement for an extended period and in slow motion. I say slow motion because we are dealing with a market average (the sp500). One just has to imagine all the different stocks of the sp500 at various stages of their near vertical price movement. Near the end stage is when most of them should be trading into a vertical zone. We appear to be right in the epicenter of this type of action right now and I suspect it will last a while longer. How long a ‘while’ is of course still open to interpretation. I have a new longer term theory on it below.
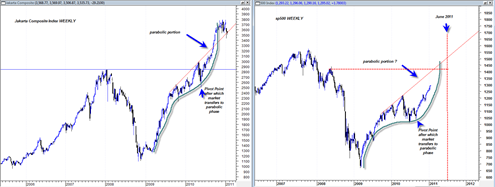
I think it is helpful to look at the Jakarta Composite Index as an example of how a market index can decline by 60% and then fully recover in parabolic fashion to new all time life time highs. I am not suggesting that the JCI leads the sp500 or that they are tied at the hip. It is just an example of ‘what is possible’ and shows the potential ‘yo yo’ nature of current market indices.

Looking at the weekly index charts above shows my point. The parabolic S forms after the pivot point is created and then second follow on upward leg matures. In the case of the Jakarta Composite Index, we see that it even managed to break upwards to new life time highs.
Whether or not the sp500 will be able to accomplish this in the years ahead will be very interesting. My guess is that it will not be able to, but it is way to early to make such a call.
The sp500 chart shows that 1400 range is going to be extremely difficult resistance to get through when combined with the horizontal resistance zone and the top channel boundary.
In addition it is also important to be aware now that we are starting to come close to the June 14, 2011 8.6 year global economic confidence model cycle turning point courtesy of Marty Armstrong (formerly of PEI international). This 8.6 year cycle has a reputation for potentially being very precise at nailing turning points in the market and my current view of the market shows that the one on June 14, 2011 should be no exception.
Interesting that on November 5, 2010 I wrote:
It is very interesting that the current advance seems to have similar dynamics and that we also find ourselves close to the next major Marty Armstrong 8.6 year cycle turning point which falls on June 13, 2011. I can see the market moving up right into the June 14, 2011 cycle turning point and then stalling near the June 30, 2008 quarterly swing high near 13,100 in the DJIA. Quarterly RSI should provide major resistance for the market next year.
This statement seems to make a good bit of sense to me right now and after looking once again at the quarterly RSI values for the sp500 and DJIA I can see clearly how the June 13, 2011 turning point could fit in nicely with quarterly RSI hitting resistance.
See this previous piece I wrote on the Marty Armstrong Cycle Turning Point and the 1970s pattern similarity.
But there are two ways to interpret the June 14, 2011 cycle turning point. The market can either blast higher right into that date, OR it can start a correction sometime this year and go DOWN into that date.
The answer to whether we trade down into June 14, 2011 or UP into June 14, 2011 of course at this time is unknown. Current overbought levels seem to suggest we could trade down into it. But the parabola market extension could lead to the market trading up into that date.
I think the longer term bullish case is better sustained with the market starting to correct down into that date in the months ahead. This would then seem to provide support for a major follow on leg thereafter.
It would seem to be less bullish if we continue in parabolic fashion back up into that date, especially if we get near vertical price action into that date.
June 14, 2011 could very well be the outstanding shorting opportunity of a life time if the market somehow manages to trade parabolic up into this key date.
Marty Armstrong cycle dates are not always extremely precise, but sometimes they are very precise. I have seen them call major major turns in the market down to a precise single date.
The most memorable one for me was the July 21, 1998 8.6 year global turning point. This turning point was extremely precise and led to a nasty panic cycle in the market. I remember I had a boat load of CSCO out of the money puts at the time, but then I also remember that I was much too greedy and too slow to close out the position and ended up giving up most of my profit.
See my previous post that talks about this Marty Armstrong 1998 July 21 turning point (The Most Powerful Cycle Model Ever Created).
I am theorizing heavily in this post on the June 14, 2011 cycle turning point, but again, the reality is that we just will not have a clearer picture until we get very close to that date.
Quote
It is important because it tell us that we are in a special market environment with extraordinary persistence.
Unquote
Are “we in a special market environment”? Is it different this time? Is that a fact as the sentence above would suggest?
I do not believe it. The fundamentals are not there. I definitely do not give myself credit for trying to be able to speculate successfully for the parabolic rise or play for the last chair in a game of musical chairs. For the bears, todays action was just another jolt, one of many many many that are resulting in investor sentiment persistently becoming more bullish, e.g. in the latest week, the Consensus Index was 73% bullish.
I admit I don’t know. I have been making money in trades of a couple of days.
A couple of points though are worth noting. I have been studying the algorithm techniques used by the big boys. The billion dollar traders.
Their algorithms are all most all designed to push the market UP!
The algorithms are designed to take minuscule profits with each up side tiny tick. If you follow the math you can see why that is, the push down is finite the push up is infinite!
The second point is that the Fed wants the market to go up!
End result. Dark energy is pulling the market UP!
Ergo the move could be astronomical!
June, 14 th is Armstrongs turn date, but which market will turn? It could be any market. Does Armsteong think its SnP 500 ?
Well it certainly was not special today. Seems as thought the 1300 range on the sp500 is starting to act as quicksand for the market. Will be interesting to see how much of a decline we can get going from this level. Will reveal whether or not we will be able to break through it later or not..
“Dark energy” sounds as ominous as “cardinal climax”. Remember that much talked about, sure fire – not to be missed event forecast for anywhere from late July to mid-August 2010. Maybe the dark energy will have the opposite predictive power as did the cardinal climax.
exactly HOW do you study the algorisms of the ‘big boys”? you must have one helluva intelligence network!
That is a good point John. The market that turns does not have to be the sp500. It could be gold, the dollar, or an different international index. He mentioned in his latest report about how it would be ideal for the market to drop into that date to set the stage for another extended advance thereafter.. But I do not believe he mentioned the sp500. Still I have seen his model align with the sp500 many times and I see no reason why it should not do so again.
http://www.scribd.com/kzuur58
It is interesting that you mention the cardinal climax date of August 27, 2010. As it turns out that marked the exact low of this mega run. So in hindsight we see that this cycle date completely inverted.
going back over your posts between mid June to early August, i thought the cardinal climax was supposed to occur between late July and August 14 – – – – – not August 27th
Yes there was this window of dates that made up the cardinal climax however as I recall Larry P indicated that August 27 was the ‘big one’ that made everything else pale in comparison. At the time he was extremely bearish and looking for a crash into that date.
As it turns out this date marked the exact low of the market and shot the market up to the moon.
He should really always say the disclaimer that his astro dates can invert because it can trade helpless traders on the wrong side of the fence with not time or psychology to react. Shame on him.
Anyway, he also indicated that IF we were to somehow break back under the level marked by August 27, 2010 in the future, it would be a very very important signal given the magnitude of importance this date supposedly has.