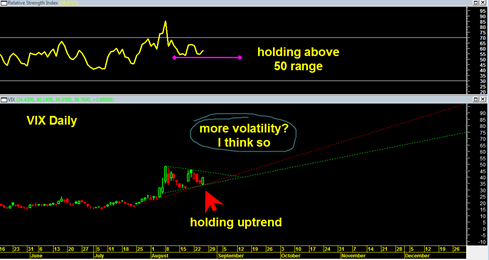
The volatility index continues to dance along its smooth up trend line and continues to fill out this apparent symmetrical triangle formation which typically is a continuation pattern.
Today the VIX engulfed yesterdays small candle body and closed near the highs. Everything about the VIX current pattern, structure and duration seems to suggest it wants to break out topside. That would mean the market busts down the next week and tomorrow.
Also noteworthy is that the RSI of the VIX has held ground above the 50 range and double bottomed on that range. Looks constructive to me.
I also find it quite interesting how gold sold off the last three days to deep oversold level and everyone talking about gold bull being over immediately. I disagree. The sharp sell off in gold before tomorrow’s key date sets gold up in a position to rally higher like you have never before seen in your life.
It would have been much WORSE for gold to have peaked at a high near 2000 at today’s close. Instead it sold off into today and now sets up a HUGE rally and spike higher above the 2000 level the next several days.
And for those who are looking for more bearish action in the market, in my opinion it would have been much less bearish if we saw equity prices the last 3 or 4 days declining into today. Instead, during the last three or four days we had a big rally into the Jackson Hole meeting which to me is a much more bearish potential setup.
Do you follow?
Gold sells off into Jackson hole and Stocks RALLY into Jackson Hole.
Gold has been trading like rocket fuel inverse to the stock market’s recent decline.
So now both of them are set up to trade inverse again, possibly in a big way. Gold rockets HIGHER and stocks sell off lower and gold does so in reaction to stocks getting dumped. Gold can do this easily as an automatic rally and can easily over take 2000 level in a week!
The VIX structure seems to be confirming gold’s setup.
So as of today’s close this looks like quite a highly probably scenario.
The VIX chart looks almost too perfect and too regular. Can it really be this easy?
Triangles can be very fickle. Sometimes one sees a first FALSE downside breakout and then an eventual resumption back inside the triangle and upside breakout (busted pattern setup). I don’t know if that will happen with this VIX chart but I can’t rule it out. For now this chart says to me it wants to bust topside, but it may be an uneven path to that destination…

